A new RCT published in JAMA pediatrics compared growth and other clinical outcomes between infants <33 weeks gestation and <1250g who were managed with routine gastric residual measurements or without. (Parker LA, et al. Effect of Gastric Residual Evaluation on Enteral Intake in Extremely Preterm Infants: A Randomized Clinical Trial. JAMA Pediatr. 2019) I was quite interested to read this when I saw the title, unfortunately the way it was analyzed, and the way it is presented make it nearly impossible to interpret. In addition there is at least one major error in the data presented.
The first problem is that although the “standard care” group has residuals measured, there is no indication of how they were interpreted. In the protocol which is provided as a supplemental file, the only mention of the feeding standards is as follows :
In addition, the nurse assesses the infant for any signs or symptoms of feeding intolerance or NEC (i.e., abdominal distension and/or tenderness, increased abdominal girth, visible bowel loops, presence of emesis, and visible blood in the stool). It is standard protocol to aspirate RGC prior to each feeding. However, for this study, this will only occur in infants randomized to Group 1.
What was done with any of this information is not described. Was the volume considered important? The colour? Presumably they didn’t aspirate prior to each feed in order to ignore the findings.
The next big problem is the primary outcome: “weekly enteral nutrition measured in mL/kg for 6 weeks after birth”, I am not sure what that means. Did they add all the intake over 6 weeks and compare between groups? Did they compare after each week, and so do 6 comparisons? Apparently, from the protocol, the plan was to do a t-test, designed for groups with unequal variance (“Welch adjusted” they call it). But the analysis which is presented is a Generalized Linear Mixed Model, which is a term that doesn’t tell me anything, but it seems to have been some sort of repeated measures test, which therefore should account for the multiple comparisons.
So what did they find? What were the primary outcome data for the two groups? I don’t know. Nowhere in the manuscript are the primary outcome results given. They do give a p-value however! In table 2 the first group of numbers are for weekly feedings in mL/kg/d and the p-value for Treatment is 0.048, but the actual numbers are written as NA. The next group of numbers are for the “simple main effect” and give some numbers which are not consistent with anything else they have written, i.e. for week 6 the numbers are “128.4 (119.9 to 136.9)” and “141.6 (133.2 to 150.0)”, according to the methods this should be the weekly feeding volume which seems quite unlikely. I presume this is either the daily volume on the last day of week 6, or the averaged daily volume over the 6th week. And I have to guess that the figures in parentheses are mean plus or minus 1 standard deviation, but that is never specified.
As far as I can tell then, by week 6 the babies were receiving inadequate feeds if they didn’t measure gastric residuals, and even more inadequate feeds if they did! To only achieve 140 mL/kg/d after 6 weeks of feeds in a group of babies with a mean of about 27 weeks and 900 grams seems to be well below what we should be achieving. As a result the growth outcomes are very poor, a 27 week baby weighing 900 grams, should by 6 weeks of age be weighing about 1400g, but, from one of the few results that are presented as interpretable data, both groups weighed just over 1100g (which I think are means adjusted for covariates)
Many of the results are presented as “least square means” which is an SAS (that is a particular stats software package) jargon for means, adjusted for covariates. Which again makes them difficult to interpret. Some of them are presented as the “mean estimated log weights” in the abstract, and sometimes in the abstract they are completely unexplained: “the no residual group were discharged 8 days earlier (4.21 [95% CI, 4.14-4.28] vs 4.28 [95% CI, 4.19-4.36]; P = .01)” 4.21 what? (I could have written WTF? but I am too polite).
It is not really surprising that not measuring aspirates would accelerate feed progression, even though here the weekly increase is from a desperately slow 18 mL/kg/d to an extremely slow 21 mL/kg/d. The big question is, is it safe?
Here again there are problems, in the abstract and in the text it is stated that the Odds for developing NEC in the intervention vs control group are 0.58 [95% CI, 0.18-0.19] vs 0.026 [95% CI, 0.006-0.109]). Which would be a 22-fold increase in the Odds of NEC, or an Odds Ratio of 22. But of course an Odds of NEC in the intervention group of 0.58 would mean that there were 25 cases of NEC and 44 without NEC, so that isn’t likely either, especially as the odds doesn’t lie between its 95% confidence intervals, which is impossible.
There is some potential clarification from the body of the article, in table 5 it is noted that the “odds” of NEC was 0.058 (0.018, 0.19) and in the results at the end of the section describing the subjects it is noted that 4 patients in the intervention group were withdrawn for NEC. Four out of the 69 intervention patients makes an incidence, a rate, or a frequency of 5.8% or 0.058. But it does not make an Odds of 0.58, the Odds of NEC is 4/65 (NEC/no NEC) which is 0.061. It looks like there were probably 2 cases of NEC among the 74 standard care group, for an incidence of 2.7%, and an odds of 0.0278.
After slogging my way through all these results it appeared that there were about twice as many cases of NEC in the intervention group as in the controls. I thought I was getting this all clear when I looked at the flow chart, the CONSORT figure, which states that there were 7 cases of NEC in the intervention group, and 4 cases in the controls. Which completely messes up all my attempts to understand this article. If there were 7 cases of NEC, then the incidence of NEC among the intervention babies is actually 10.1%, and the odds is 0.012, compared to 4 controls. with a frequency of 5.4% and an odds of 0.057.
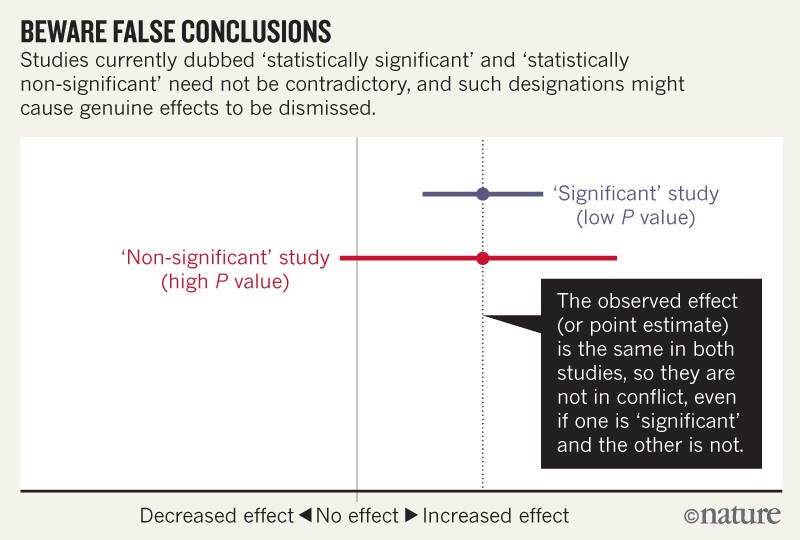
In the discussion the authors state “we found no differences in incidence of NEC” which is clearly untrue, the incidence of NEC was quite different between groups. A true statement would have been “the difference in incidence of NEC that we found has very wide compatability limits, which include a possibility of a large reduction or a major increase in NEC”.
I think this paper is a complete failure of the review and editorial process of JAMA pediatrics (and of galley editing), how this could have been published in this form I don’t understand. It could have been a nice little RCT adding a bit more data to the question of measuring residuals, and should most clearly have stated that there was inadequate power to determine safety, and that the confidence intervals for the incidence of NEC are extremely wide. (If we assume that there were 4 cases of NEC in the intervention/no residuals group, and 2 in the controls, then the relative risk of NEC is 2.15 with 95% compatibility limits of 0.4 and 11. If there were 7 cases vs 4 cases, the RR is 1.99, 95% CL 0.6-6.5). We should also note that there were 6 deaths in the standard/measured residual group, and only 1 in the intervention/no residual group; which gives an RR of 0.19, 95% CL 0.02 to 1.5).
As it is we still are not clearly any the wiser, after a trial where it is not clear what was done or what was found.
I don’t take note of residual volumes, I have worked at one place which had not measured them for 15 years, and in 2 other places we stopped routinely measuring residuals completely while I was there. All that observational data suggests no benefit, and potential nutritional harms from measuring gastric residuals, but some stronger data, to convince other units to stop the practice if it is indeed safe, would have been helpful to improve nutritional outcomes of our very preterm babies.