I think the word “significant” should be banned. (Not in life; I am not a fascist; you can say whatever you want is significant, but in medical research there is so much confusion about the term that we would be better to never use it!)
I think authors who find a potentially positive result in a good quality study should be allowed to say things like “if there were no other unanticipated biases in our research design, the likelihood that our results are due solely to random variation is less than 1 in 20”, which is less sexy, but more accurate, compared to saying “our results were significant”. (If there are any real statisticians out there reading this, and I say anything which is not accurate, please let me know, I only have basic statistical training and would be happy to be corrected!)
It would certainly be much better than assuming that p<0.05 means that you definitely found an effect, or that p>0.05 means that there is nothing there!
In this blog I usually try to avoid the term “statistically significant” (or not), as the term is often used to imply “proven effect” as compared to “proof of no effect”. I hope we all know that the threshold, where p=0.051 means no effect, and p=0.049 means proven effect, is nonsense. Some journals have banned the reporting of p-values and even confidence intervals, as a result. I think this is extreme, I think we should be able to report confidence intervals, but that multiple confidence intervals, 90, 95, and 99% should perhaps be demanded. And also appropriate wording, similar to what I suggested above. The risk is that a 95% confidence interval which excludes unity will be considered to be proof that there is a real difference, which is no better than using a p-value threshold. The differing confidence intervals could be used to give an overall estimate of an effect, and its potential ranges.
In this blog I probably sometimes get caught up in the usual patterns of referring to p-values, but usually I try to say something like “not likely to be due to chance alone”, which does not mean that a difference is necessarily due to a real effect of the intervention, but that the data would be unlikely if you picked the numbers at random out of a soup of numbers. All sorts of things might cause a p-value to be less than 0.05 when you compare outcomes between 2 groups with a different intervention, only a minority of which are due to a true impact of the intervention.
A study with an unknown bias might well provide a “significant” p-value when there is no real effect of the intervention, just as a study with a “non-significant” p-value might report a major advance in medicine.
The authors of that recent paper put it this way :
It is true that the smaller the P value, the more unusual the data would be if every single assumption were correct; but a very small P value does not tell us which assumption is incorrect. For example, the P value may be very small because the targeted hypothesis is false; but it may instead (or in addition) be very small because the study protocols were violated, or because it was selected for presentation based on its small size. Conversely, a large P value indicates only that the data are not unusual under the model, but does not imply that the model or any aspect of it (such as the targeted hypothesis) is correct; it may instead (or in addition) be large because (again) the study protocols were violated, or because it was selected for presentation based on its large size.
There have been recent publications suggesting that the critical P-value should be shifted to a much smaller number (such as p<0.005), particularly for epidemiological, rather than interventional studies. But I think that will just shift the problem, and will make it harder to find really useful beneficial effects, or to potentially harmful results.
Abandoning the term “statistically significant” should be enforced, and will force us to makes more nuanced and reasonable evaluations of our data.
For a few years now Annie Janvier in our unit has been developing programs of partnership with families. Using contacts with mostly “veteran parents”, and occasionally veteran patients, we have developed partnerships in research, patient care, and education.
The new article is an in-depth evaluation of the PAF team development, evaluation, and improvement, some of the mistakes made along the way, and some principles, many of which are probably generalizable, that can be used to help in the process.
The title, I think, is apposite, although many of us have been discussing how to involve parents over the past few years, often the involvement of parents has been seen as a “nice extra”. In contrast, I think we should consider that everything that we do will benefit from the full integration of resource parents in our teams, and that having a token parent seat at the table is not enough.
For anyone who doesn’t have full text access to the Journal of Pediatrics, Annie gave me permission to include the following link in this blog post https://authors.elsevier.com/a/1YnEL55CrsVAw the first 50 people accessing the link can download a free full text.
The PAF initiative costs very little, but there are some costs, mostly for parking, snacks, our wall of hope, and other minor costs. Our goal for fundraising this year is only $12,000 (Canadian), please consider making a small donation to our team. If you like this blog, please consider making a large donation!
Many babies receive some sort of “resuscitation” during their transition from intra-uterine to extra-uterine life.
How do we decide when a baby needs intervention? A baby who is active and breathing is usually left alone, a baby who is neither of those things might need intervention, and many of our decisions are based on the baby’s heart rate.
Bradycardia= needs ventilation. Mild bradycardia= optimize ventilation and reassess, good heart rate = observe and wait. I like things to be simple!
Recent studies have focused on heart rate determination as the best indication that adaptation is appropriate, but that begs the question:, how to determine heart rate? Should we listen to their heart sounds, palpate their pulses, or watch their ECG? It seems that getting an accurate heart rate is faster with immediate ECG application (Katheria A, et al. A pilot randomized controlled trial of EKG for neonatal resuscitation. PLoS One. 2017;12(11):e0187730) and that this might lead to more rapid institution of corrective actions. But electrical activity of the heart does not mean that it is pumping well; in animal models pulseless electrical activity is frequent. Many immature animals, after resuscitation, have periods of electrical activity without mechanical activity. If that happens with babies, then we may have to readjust our algorithms; presence of an ECG signal does not mean that you necessarily have adequate cardiac function.
What I think this means is that, when resuscitating depressed newborns, the ECG might be very helpful to get an accurate heart rate quickly, and if the heart rate is slow we should respond according to NRP algorithms.
At some point we should confirm that there is actually cardiac contraction, not just electrical activity. If the infant starts to move and breathe, that is probably enough evidence. BUT, if the ECG heart rate is present but the baby isn’t improving, we should immediately evaluate whether there is sufficient cardiac activity.
In the cases we report there was ECG activity, but no actual cardiac function detectable, when that was recognized and interventions followed, all the babies were severely damaged, and they all died. I wonder if the situation had been recognized faster, could there have been better outcomes? We could even ask if those babies would have been better treated without the ECG?
Maybe the introduction of the ECG as a routine measure of cardiac activity during neonatal resuscitation has been an error?
How should we determine that the heart is actually contracting effectively? I think if the pulse oximeter is giving a reliable signal, at the same rate as the ECG, that means there is at least some arterial pulsation in the right wrist/hand and probably perfusion is at least minimally effective: if the pulse oximeter is not (yet) functioning, then palpation of the pulses may be adequate, or perhaps clear heart sounds are enough evidence that the heart is actually moving…
I’m not sure what the best approach is, but recognizing that the ECG only identifies electrical activity, and that actual cardiac pumping is what the baby needs, is the first step.
We have a big problem in neonatal research. We have constructed composite outcomes that have become the “standard of design”, but are not of much use for anyone. Because we are, rightly, concerned that death and other diagnoses may be competing outcomes, we often use as the primary outcome measure “death or BPD” or “death or severe retinopathy” or death or “neurodevelopmental impairment”. We have done this because dead babies can’t develop BPD, or developmental delay.
The idea, of course, is that we want to see if an intervention will improve survival without lung injury, for example. There are two problems with this, if the outcome is more frequent, but neither part of the outcome is individually significantly affected. What then? The other problem is that we might well find that death is less frequent but that lung injury is more frequent. And what then? If the composite outcome is unchanged, then strictly speaking we can only say that the study found no effect on the outcome, and an analysis of the parts of the composite outcome are considered secondary analyses.
This happens. The SUPPORT trial showed no effect of oxygen saturation targets on the primary outcome, but the low target babies had more mortality, while the high target babies had more retinopathy.
Study designs like this are effectively equating the parts of the primary outcome in importance for the analysis.
By studying the outcome of “death or BPD” we are effectively saying that an adverse outcome is being dead or being on low-flow oxygen at 36 weeks. I don’t think many readers of this blog would agree, if they themselves were critically ill, that surviving with a need for long-term domiciliary oxygen and being dead were equivalent.
They had to be ventilator dependent at 7 to 14 days of age with a respiratory index (product of mean airway pressure and the fraction of inspired oxygen) equal to or greater than 3.5 for more than 12 h/d for at least 48 hours.
Which would mean for example a mean airway pressure of 8 and an FiO2 of 0.44.
During the initial months of the trial, participating centers noted that many infants receiving ventilation and considered at high risk of BPD had a respiratory index of less than 3.5 and were treated with corticosteroids outside the trial. Based on this feedback, the respiratory index threshold was reduced to 3.0 and finally to 2.5 (in May 2012 and December 2012, respectively) via approved protocol amendments.
By the end of the trial, then, an infant at 7 days of age, with a mean airway pressure of 8 on 32% oxygen or more would have been eligible.
The definition of BPD was oxygen requirement at 36 weeks (with an O2 reduction test if needing less than 30%). Death was also recorded to 36 weeks for the primary outcome. Which means that dying between 36 weeks and discharge would be considered a good outcome, if you didn’t have BPD.
The primary outcome occurred in 128/181 hydrocortisone babies (70.7%), and 140/190 controls (73.7%). In other words there was no impact of the hydrocortisone, which is what the abstract states. But at 36 weeks there were significantly, and substantially, more babies who received hydrocortisone alive than controls, 84.5% vs 76.3%, which was “statistically significant” p=0.048. Between 36 weeks and hospital discharge there were several deaths in each groups, and the difference had narrowed slightly, with 80% of hydrocortisone babies and 71% of control babies being alive, p=0.06.
This happened despite a very high rate of open-label hydrocortisone use in the control babies. In fact 108 of the 190 control babies received hydrocortisone.
The protocol is available with the publication, and it notes the following :
In case of life threatening deterioration of the pulmonary condition, the attending physician may decide to start open label corticosteroids therapy in an attempt to improve the pulmonary condition. At that point in time the study medication is stopped and the patient will be recorded as “treatment failure”.
This could occur during the 21 days of study drug use. In addition, physicians could give steroids after the 21 days of the study drug:
Late rescue therapy outside study protocol (late rescue glucocorticoids): Patients still on mechanical ventilation after completion of the study medication, i.e. day 22, may be treated with open label corticosteroids.
I’m not quite sure about this, but I think that 86 of those 108 control babies who received hydrocortisone got it during the 21 days study drug window, and 22 others received steroids after the study drug period. In the hydrocortisone group I can see no indication of how many got open-label steroids during the study drug period, but there are 6 who got steroids after the end of that period.
The substantial differences in mortality are despite a very high rate of treatment of babies randomized to control who received hydrocortisone, which will of course dilute the potential impact of the intervention.
There are modest differences in BPD between the groups, with the hydrocortisone babies having slightly more (100 cases vs 95), but if you express this result as “BPD among survivors”, the numbers are actually identical; just over 65% in each group.
I think the best interpretation of this study would be as follows: eligible babies who received immediate hydrocortisone, compared to those who waited and only received hydrocortisone in the case of a “life-threatening” deterioration, were less likely to die, but, if they survived had the same likelihood of developing BPD.
I hope there is neurological and developmental follow up planned for this trial, although the power of the study to say very much, when so many control babies received hydrocortisone, will be quite limited.
This is now a huge problem, the published article states there is no effect of hydrocortisone, but that is not what I get from the data.
Here is the cute graphic that accompanies the paper
What can we do about this? Based on this study, the use of hydrocortisone in a similar dose, to infants with substantial oxygen requirements after 7 days of age would be a reasonable choice. Waiting for life threatening deterioration (it would be interesting to know what that meant to the attending physicians!) seems to increase your risk of dying. I think it is unlikely that any neurological or developmental impacts of hydrocortisone are severe enough to be worse than dying, and I just hope that any long term outcome study of these infants does not use the outcome “death or low Bayley scores”.
Analyzing the deaths differently using survival curves gives the following, with a p-value suggesting that this is unlikely to be due to chance alone. I know it’s a bit more than .05, but there is only 1 chance in 17 that completely random numbers would give a difference like this :
I think we have to stop using “death or BPD” as a composite dichotomous outcome for our studies.
There are alternatives, even when death and the other outcome of interest are competing.
One way is to analyze the same data differently. One method, for example, is to compare each babies outcome to all of the babies in the other group. A baby who dies receives zero points in comparison to the other group babies who died, receives -1 point in comparison to the other group babies who survived. Each surviving baby with BPD is then scored +1 point in comparison with the other group babies who died, zero points in comparison with the other group babies with BPD and -1 point in comparison with the surviving babies without BPD, and babies without BPD score +1 in comparison with babies who died or survived with BPD, and score 0 in comparison with babies who survived without BPD. The ratio of winning to losing babies is then referred to as the “win ratio”.
For example, if you ran a study with 20 babies per group, and the results showed group A had 5 deaths and 10 survivors with BPD, group B had 10 deaths and 5 with BPD. Our usual analysis would say there was no impact on “death or BPD”. The analysis that I have just suggested, in contrast, gives a score in group A to each one of the dead babies of -10, and -15 to those in group B. The BPD babies each score+5 in group A and 0 in group B, and the survivors without BPD score +15 in both groups. The win ratio for the trial is 3.0 for group A, as there are 15 babies who win overall in most of their pairwise comparisons, and 5 who lose. Calculating the p=value for this is complicated, but well described, and methods for calculating the confidence interval of the win ratio are, also.
Effectively, what this kind of analysis does is to rank the adverse outcomes, death being scored before BPD.
I would be fascinated to see what the results of STOP-BPD would look like if this kind of analysis was performed, the win ratio of the hydrocortisone group works out to 5.2 to my calculation, compared to 3.4 for the controls. It could be that such a difference is statistically significant, and such an analysis might enable future trials to be designed using this method.
You can also with this technique examine different severities of BPD, with BPD being scored as moderate vs severe. This kind of analysis can also include longitudinal quantitative measures, such as duration of home oxygen therapy, or number of admissions after discharge. Things which are, I would suggest, far more important to parents than whether the oxygen is stopped before or after 36 weeks.
Before there are any other trials counting death and BPD as equally important outcome measures, or death and retinopathy, or death and developmental delay, or “death, BPD, NEC, LOS, IVH, ROP” we should reconsider how we measure and analyze outcomes. We should be including outcomes that are important to families, rank them according to their relative importance to parents, and analyze them using methods which are now well validated which take into account their relative importance.
Two recent trials in adult ICU patients ask very interesting questions, questions which are only linked by testing something clinically simple versus a more technologically demanding evaluation.
This might be most important in countries with limited access to laboratory results, but in all countries, if our clinical evaluation of perfusion is accurate and can be followed in almost real-time and responds more quickly to changes in actual perfusion, then it would be an advantage for all of us to include it in our protocols.
28 hospitals in 5 South American countries participated in a trial which enrolled 424 adults with septic shock. The protocols for following either serum lactate or capillary filling time were clearly documented, and mostly followed. Cap filling was performed in a highly standardized way with a glass slide used to compress a nail bed of hand until blanched for 10 seconds, then released and the return of colour was monitored with a stop-watch.
To spare you all the details of the protocols, they were very similar apart from the methods used to evaluate perfusion.
Mortality was 35% in the cap filling group and 43% in the lactate group. This was not “statistically significant” but it looks to me like a big deal! I guess I should say now that the study was underpowered but having read this really clear blog post about using that phrase (https://towardsdatascience.com/why-you-shouldnt-say-this-study-is-underpowered-627f002ddf35) I will say that the study was underpowered to detect really important differences in mortality, differences that that anyone who has septic shock might be interested in.
In fact the 95% confidence intervals for the hazard ratio only just include 1.0 (0.55 to 1.02) and the p-value was 0.06, which might not conventionally be “significant”, but is at least highly suggestive. The patients in the cap refill group received about 0.5 L less fluid during the resuscitation phase, and had less organ dysfunction. Again suggesting that maybe we often give too much fluid to patients with septic shock, leading to organ dysfunction and death.
There were no advantages shown to the more invasive strategy, so the simple clinically directed adjustment of PEEP was equally effective.
One reason for discussing this study is that they don’t analyze “BPD or chronic lung disease” as an outcome! The primary outcome and the method of analysis are fascinating :
The prespecified primary end point was a ranked composite score that incorporated death and days free from mechanical ventilation through day 28, calculated in such a manner that death constitutes a worse outcome than fewer days off the ventilator. Time free from mechanical ventilation was calculated as the number of days between successful liberation from the ventilator and study day 28. Each patient was compared with every other patient in the study and assigned a score (tie: 0, win: +1, loss: −1) for each pairwise comparison based on whom fared better. If one patient survived and the other did not, scores of +1 and −1 were assigned, respectively, for that pairwise comparison. If both patients in the pairwise comparison survived, the assigned score depended on which patient had more days free from mechanical ventilation: the patient with more days off the ventilator received a score of +1, while the patient with fewer days received a score of −1. If both patients survived and had the same number of days off the ventilator, or if both patients died, they both were assigned a score of 0 for that pairwise comparison. For each patient, scores for all pairwise comparisons were summed, resulting in a cumulative score for each patient. These cumulative scores were ranked and compared between treatment groups via the Mann-Whitney technique.
I think there are some very important lessons to be learned here. You can incorporate potentially competing outcomes without giving them the same importance in the analysis. In this analysis death is clearly considered more important than getting extubated more quickly.
The above title is the title of a talk I just gave at the NEO2019 conference. I have made available a .ppt file of the final slides from the talk, under the tab at the top of the page “presentations”. The version in the App, which is made available to participants at the conference, is slightly different to this final version.
My review of the literature led to the following conclusions
Among very preterm or very low birth weight infants :
Growth and bone mineralization approaching desired standards can only be achieved by fortifying BM
Commercial bovine or human multicomponent fortifers have become the standard of care
Desired growth can be achieved with maternal BM and fortification, or donor BM and fortification, if enough attention is paid to growth
Donor BM has less protein (and slightly fewer calories) than preterm maternal BM, for a few weeks, and requires higher supplementation
And then in terms of the scientific evidence about what and when:
When maternal breast milk supply is insufficient to meet the baby’s needs: supplementation with formula increases NEC compared to donor BM (Older and recent studies, moderate to good quality data)
Multi-component fortification, with powdered bovine-protein based products, has not been shown to affect NEC compared to no fortification (almost all studies before 2000, poor to moderate quality data, wide confidence intervals)
Multi-component fortification from different sources (bovine compared to human) has not been shown to change the incidence of NEC, when used with a strategy of maternal or donor breast milk (moderate quality data, wide confidence intervals)
Individualized fortification using BM analysis not shown to improve clinically important outcomes compared to adjustment according to growth (poor quality data, small studies, wide confidence intervals)
Early introduction of fortifiers has not been shown to adversely impact clinical outcomes or complications compared to >100 mL/kg/d (poor quality data, one study, wide confidence intervals)
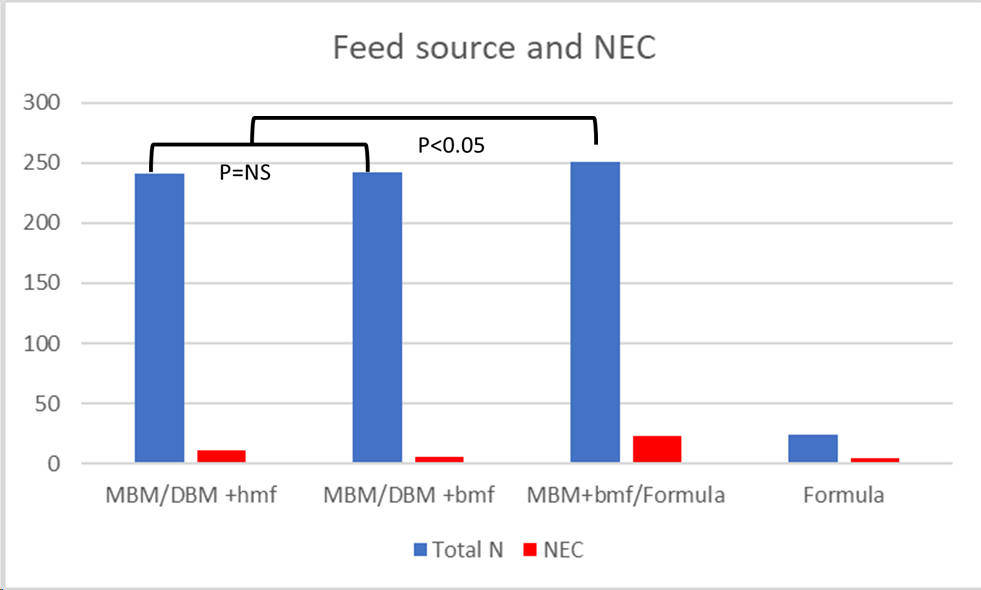
The data about human versus bovine based fortifiers for expressed breast milk feeding in the very preterm are based on only 3 small studies. All of which I have discussed previously on this blog. I created a graphic using the data from these trials, comparing the overall incidence of stage 2 NEC or greater with each feeding strategy. The strategies being 1. Maternal BM with Donor BM as a supplement when insufficient MBM, both fortified with human-milk-based fortifier (MBM/DBM+hmf) 2. Maternal BM with Donor BM fortified with bovine-milk-based fortifier (MBM/DBM+bmf) 3. Maternal BM, fortified with bovine-milk-based fortifier with preterm formula as as supplement. 4. Preterm formula.
Cristofalo EA, et al. Randomized trial of exclusive human milk versus preterm formula diets in extremely premature infants. The Journal of pediatrics. 2013;163(6):1592-5 e1. Sullivan S, et al. An Exclusively Human Milk-Based Diet Is Associated with a Lower Rate of Necrotizing Enterocolitis than a Diet of Human Milk and Bovine Milk-Based Products. The Journal of pediatrics. 2010;156(4):562-7.e1. Trang S, et al. Cost-Effectiveness of Supplemental Donor Milk Versus Formula for Very Low Birth Weight Infants. Pediatrics. 2018;141(3).O’Connor DL, et al. Effect of Supplemental Donor Human Milk Compared With Preterm Formula on Neurodevelopment of Very Low-Birth-Weight Infants at 18 Months: A Randomized Clinical Trial. JAMA. 2016;316(18):1897-905.
Strategy 1 was an intervention group as each of the first 3 of those trials, Strategy 2 in Trang and O’Connor, strategy 3 in Trang and Sullivan, and strategy 4 in Cristofalo.
I stress that this is not a formal SR and meta-analysis! The p=values are the typical p=values from the initial publications
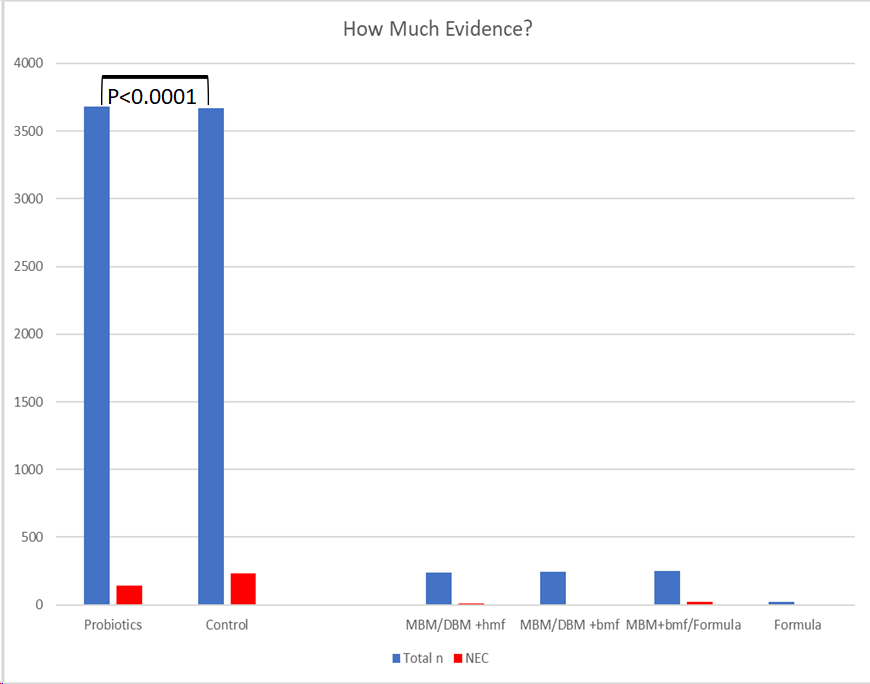
I think it is interesting to compare the tiny amount of information we have about different sources of fortifiers and milks for their impact on NEC, to the evidence which exists from RCTs of probiotics. The latest systematic review/meta-analysis included about 3,600 patients per group.
I find it distressing that fortifiers, which are given to fragile, high-risk, babies 8 (or 12) times a day for several weeks, do not have to provide the same kind of proof of safety and efficacy as a new drug, which may be given 2 or 3 times a day for a week. We end up in a situation where thousands of babies are being exposed to these agents with very poor quality evidence that they are equivalent to each other.
Given these limitations of the proofs, an evidence-based protocol for breast milk fortification would look like this
For infants at risk of NEC:
Promote maternal breast milk as much as possible, early expression, lactation consultants, pumps freely available everywhere…
When MBM insufficient, always use donor BM, until risk of NEC passed (no good data on when to stop donor milk, 34 weeks post-menstrual age seems reasonable)
As feeds advance, fortify breast milk as soon as TPN can not meet nutritional requirements of the infant (which will usually happen around 50 mL/kg/d)
Start with standard fortification, up to an assumed calorie density of 24 kcal/oz for maternal BM, and start at a higher dose for donor BM (assumed calorie density of 26 kcal/oz) because donor BM has less protein.
Use powder or liquid fortifier, there is no proven advantage of one over the other.
Use bovine or human-based fortifier, there is no proven advantage of one over the other if MBM is supplemented with donor BM.
Concentrate on growth, review frequently and increase fortification if growth < target for 2 wk, at ≥ 160 mL/kg/d, then re-assess frequently.
So what about the idea of trials examining even higher oxygen saturations? Is there a chance we might further reduce mortality by aiming for saturations in the mid-90’s rather than the low 90’s?
Not so fast, even for adults that may be a really bad idea!
A fascinating systematic review, the IOTA study, was published last year in The Lancet. Chu DK, et al. Mortality and morbidity in acutely ill adults treated with liberal versus conservative oxygen therapy (IOTA): a systematic review and meta-analysis. Lancet. 2018;391(10131):1693-705. This study found 25 trials including 16,000 adults; baseline saturations were in the mid to upper 90’s in most studies, and interventions varied, but included one, liberal, group with more oxygen and a higher target saturation, and another, conservative, with more restricted oxygen use (either room air, or only when necessary, or a lower concentration as a routine compared to the liberal group). The review found a 20% increase in in-hospital mortality RR 1·21 (95% CI 1·03–1·43) with more liberal oxygen use. I remember my days, many years ago now, as an SHO (junior resident) in general internal medicine, anyone with chest pain, breathlessness, or just looking a bit peaky, would get oxygen cannulae slapped on the moment they arrived in the emergency room (or A&E as we called it). We didn’t have pulse oximeters back then in the dark ages, and didn’t want to poke everyone’s arteries for a blood gas analysis, so routine low flow oxygen was considered safe and maybe helpful. Even today, this study informs us, 34% of adults in an ambulance are given oxygen, and in the UK 15% of adults admitted to hospital are on oxygen therapy, which they may not need to maintain acceptable saturations.
IOTA also performed a meta-regression suggesting that there is a dose effect, that the higher the saturations achieved with liberal therapy the greater the adverse impact on mortality.
Of course adults don’t have some of the hazards that we face in neonatology, they aren’t very likely to develop retinopathy of prematurity!
Also animal models use hyperoxia in the neonatal period to create pulmonary hypertension, which can be lifelong. There are numerous examples in the literature, but here are a few, some of which note the differences, and increased sensitivity of the neonate, to the effects of hyperoxia.
(Berkelhamer SK, et al. Developmental differences in hyperoxia-induced oxidative stress and cellular responses in the murine lung. Free Radic Biol Med. 2013;61:51-60. Jimenez J, et al. Progressive Vascular Functional and Structural Damage in a Bronchopulmonary Dysplasia Model in Preterm Rabbits Exposed to Hyperoxia. Int J Mol Sci. 2016;17(10). Menon RT, et al. Long-term pulmonary and cardiovascular morbidities of neonatal hyperoxia exposure in mice. Int J Biochem Cell Biol. 2018;94:119-24. Nakanishi H, et al. Morphological characterization of pulmonary microvascular disease in bronchopulmonary dysplasia caused by hyperoxia in newborn mice. Med Mol Morphol. 2018;51(3):166-75. )
Kumar VH, et al. Neonatal hyperoxia increases airway reactivity and inflammation in adult mice. Pediatr Pulmonol. 2016;51(11):1131-41. Patel A, et al. Exposure to supplemental oxygen downregulates antioxidant enzymes and increases pulmonary arterial contractility in premature lambs. Neonatology. 2009;96(3):182-92.)
To summarize, hyperoxia is toxic to the lungs, especially in the neonatal period when antioxidant defences are reduced; in addition to oxygen free radical effects, administering excessive oxygen inhibits Guanylyl cyclase activity and increases PDE5 expression leading to increased vascular contractility and a reduced effect of nitric oxide, endogenous or exogenous. The vascular impact of these changes can lead to vascular remodelling and permanent pulmonary hypertension, as well as reduced alveolarization. Even fairly brief exposure to hyperoxia can cause some of these changes (Lakshminrusimha S, et al. Pulmonary hemodynamics in neonatal lambs resuscitated with 21%, 50%, and 100% oxygen. Pediatr Res. 2007;62(3):313-8).
Not all studies show an effect on hypoxia, (Dani C. Automated control of inspired oxygen (FiO2 ) in preterm infants: Literature review. Pediatr Pulmonol. 2019;54(3):358-63), which may be partly due to apneas; if you aren’t breathing then adjusting the FiO2 is unlikely to have much impact! As Carlo Dani suggests in this review there is no current evidence that clinically important outcomes are improved, but I am going to say something which is probably unique among the posts on this blog: I don’t think we need such evidence. I can’t see any downside to reducing episodic, or sometimes prolonged, hyperoxia and hypoxia in preterm infants, or indeed in infants at term either. As long as the devices actually work, and do adjust FiO2 to achieve more stable saturations and reduce episodes of desaturation followed by re-oxygenation, and episodes of excessively high saturations, that would be sufficient for me to buy them for every baby in the NICU. I can’t see how it could possibly be harmful, and it would probably reduce nurses stress and turnover and decrease parental stress also!
Manual adjustment of the FiO2 by the nursing staff (usually in response to alarms) has been shown in some of the studies to be substantially reduced by automated oxygen control (Hallenberger A, et al. Closed-loop automatic oxygen control (CLAC) in preterm infants: a randomized controlled trial. Pediatrics. 2014;133(2):e379-85). Many times parents become stressed when their baby’s alarms ring, the most common alarm, by far, is from the pulse oximeter, and when the nurse doesn’t come immediately (most often when there is a minor desaturation or high sat alarm and the nurse knows from experience of that baby that just waiting a little while will correct the saturation) they can sometimes freak out. The extra reassurance that there is a device active which is regulating the oxygen requirements will help a little to reduce the stress of having a baby in intensive care.
Aiming for slightly higher oxygen saturation targets (low 90s) decreases mortality in the very preterm neonate (compared to the high 80s), and decreases surgical necrotizing enterocolitis, while increasing retinopathy, and the need for retinopathy treatment, in the long term there is no impact on disability, visual impairment or hospital readmissions during the first year among survivors.
There has been some controversy regarding these results, as some trials showed smaller effects on mortality than others, but there is in fact very little heterogeneity in the results. Some of the difference in results can be traced to the calibration algorithm debacle. An intensive analysis of the impacts of that problem has just been published, which includes an explanation of the issue with the pulse oximeters, supplied by Masimo.
Masimo reported that this [the calibration problem] reflected their decision to adjust the calibration of their oximeters so that at values >87% the displayed SpO2 were increased by 1%-2%. As well as fewer values than expected between 87% and 90%, this manufacturer-generated artifact returned more SpO2 values than expected >90%, thus affecting both target groups in the NeOProM trials. By elevating SpO2 readings of 88% and 89% to greater displayed values, the artifact would be expected to make the low target group range of 85%-89% narrower and harder to target. By elevating SpO2 values in the range 90%-95% by 1%-2% above the true value the artifact would mean that actual achieved SpO2 values in the high target range with the original oximeters were lower than intended, narrowing the difference in SpO2 between groups.
I have never fully understood why Masimo did this, I have heard that it was to prevent alarms due to minor desaturations, and make the oximeters more attractive to anaesthetists, but that doesn’t make a lot of sense to me. In any case this messed up the trials a little bit, when the problem was identified, Masimo adjusted the calibration of the oximeters, and oximeters with new software were used for the latter part of BOOST Australia, BOOST UK, and COT.
Ben Stenson and colleagues have now re-analyzed data from babies in the Australia and UK BOOST trials and showed that the revised algorithm led to babies being in their target group for a longer period of time, especially those in the low target group. Babies in the low target group were actually in their target range for 40% longer (relatively) when the revised algorithm was in use than with the initial calibration. The absolute difference in time of the low saturation babies in the lower target range was smaller, about 5.5%, this includes periods of time when the infant was not receiving oxygen, which is reasonable for this analysis, because a baby with exactly the same true saturation would get oxygen in the high sat group, but not in the low sat target group. If the authors had removed data from babies in room air with saturations above the high target, i.e. those whose lungs were improved and no longer needed O2 whichever group they were in, then the differences in targeting would likely be substantially greater.
The Cochrane review of all of the oxygen saturation targeting trial data showed that the overall trial results for mortality were not heterogeneous (I-squared = 0) and that overall there was a 16% relative increase in mortality with low saturation targeting (20% vs 17%).
When analyzed by the oximeter calibration, the use of a low saturation target with the new, more accurate, algorithm led to a 38% relative increase in mortality (absolute mortality 22% vs 16% with the higher target).
The publication of the NeOProM collaboration confirms this using the individual patient data, with identical results and practically identical confidence intervals. All Masimo oximeters now have the revised algorithms. The only evidence based saturation targets for very preterm infants are 91 to 95%, which should be the default for preterm infants.
Is it possible that other targets would be even better? I know there are some centres that still use targets that are different to 91 to 95%, and I think it is feasible that another target range might be better than 91 to 95%: perhaps even higher targets would further reduce mortality? Perhaps an intermediate target might reduce RoP without increasing mortality? Such thought are not unreasonable but are unsupported by any evidence. I think it is unlikely that the efforts of the NeOProM collaboration will be reproduced to examine other target ranges in the near future. The only way to do so, I think would be to perform cluster-randomized, or individually-randomized, registry based trials, with very large numbers and low-cost data collection.
The experience of these trials should make us more than ever aware of the risks of observational studies, which, before these prospective RCTs, suggested strongly that survival and outcomes would not be worse with lower saturation targets, but that RoP would be less frequent. Only half of that turned out to be true.
This experience should also make us even more reticent about composite outcomes, the combined outcome of “death or disability” was only slightly affected by the different saturation targets. So-called disability was 41% (lower target) vs 40% (higher target). Being substantially more frequent, this component of the primary outcome was more frequent than death, and caused the whole composite outcome to be not ‘statistically significant’ the relative risk was 1.04 (95% CI 0.98 to 1.09) for the entirety of the results. When subdividing the data according to the computer algorithm there does seem to be an effect of the target range on the composite outcome with the revised algorithm.
But again, when we examine the data, there was no impact on ‘disability’ with the revised calibration algorithm, RR 1.05 (95% CI 0.91, 1.22) the impact was solely on mortality. (And don’t get me started on whether a developmental screening test score below an arbitrary cutoff is actually a disability, just search for Bayley on this blog to see my opinion about that!)
There has been some concern about the analysis of the data by unplanned secondary analysis. But an unplanned analysis which is performed because the intervention changed unexpectedly (on this occasion due to the discovery of this anomaly in the calibration) is entirely different to performing a secondary analysis which is suggested by looking at the data, and seeing an interesting finding that you then analyze. The situation faced by the NeOProM investigators is analogous to a secondary analysis of a drug trial which is required because the formulation of the medication is changed during the trial, substantially increasing bio-availability of the active drug. It would be a failure to NOT perform a secondary analysis of the data according to drug formulation.
After a long break over Christmas, New Year and several periods of clinical service, I have a few posts that I am developing, hopefully you will all find them useful.
Lactoferrin is a molecule present in mammalian milk which acts as an iron transporter, hence the name. It binds to species specific receptors on enterocytes and permits iron absorption, then being recycled into the intestinal lumen to promote more iron absorption. For some reason mammals evolved to produce a molecule that also has multiple antimicrobial activities, anti-bacterial, -viral -fungal.
Lactoferrin is the principle component of whey in human milk, and a very similar protein in bovine milk is present in much lower concentrations, but has more active antimicrobial properties. As very preterm babies often have very little breast milk intake in the first few days of life they often receive very little lactoferrin.
A very well-performed multicenter trial in Italy, published a few years ago now, showed a dramatic reduction in late-onset sepsis among infants randomized to either bovine lactoferrin (100 mg per day regardless of weight), or bovine lactoferrin plus a strain of lactobacillus rhamnosus (a probiotic organism), compared to placebo. (Manzoni P, et al. Bovine lactoferrin supplementation for prevention of late-onset sepsis in very low-birth-weight neonates: a randomized trial. JAMA. 2009;302(13):1421-8). Among just over 150 babies per group (n=470 total), lactoferrin reduced the proportion of babies with at least one episode of culture-positive late-onset sepsis from about 17% to about 5% in the 2 lactoferrin groups. In that study the average birthweight of the infants was about 1100g, their average (mean) gestational age was about 29.5 weeks and there were 168 babies under 1 kg. When scrutinizing the results closely, there were a few more fungal sepsis episodes than some other groups have reported, of the 45 total babies with sepsis, 11 had a fungal infection, 9 of them among controls; and there were fewer CoNS (coagulase negative staphylocci) than some other studies, only 4 of the 45 episodes were CoNS. This was partly because of requiring 2 positive cultures for a CoNS diagnosis, if you add those with only 1 positive culture another 9 patients were positive with CoNS infection, and I don’t know what the total number of infected babies would then become, but the proportion of bacterial sepsis that is CoNS then becomes similar to other reports.
ELFIN recruited 2200 babies less than 32 weeks gestation at less than 72 hours of age, to receive lactoferrin (150 mg/kg/day; max of 300 mg/day) or placebo, mixed with a milk feed. The primary outcome was at least one late-onset infection, suspected or proven. Proven sepsis required a positive culture as well as clinical signs requiring a blood culture and an intention to treat for 5 days at least, suspected infection was defined as follows:
Absence of positive microbiological culture, or culture of a mixed microbial flora or of probable skin contaminants (ie, diphtheroids, micrococci, propionibacteria) only, and treatment or clinician intention to treat for 5 days or more with intravenous antibiotics (excluding antimicrobial prophylaxis) after the investigation was undertaken for an infant who presents at least 3 of the following clinical or laboratory features of invasive infection:
•increase in oxygen requirement or ventilatory support
•increase in frequency of episodes of bradycardia or apnoea
•temperature instability
•ileus or enteral feeds intolerance or abdominal distention
•reduced urine output to less than 1 mL/kg per h
•impaired peripheral perfusion (capillary refill time longer than 3 seconds, skin mottling or core-peripheral temperature gap greater than 2°C)
•hypotension (clinician-defined as needing volume or inotrope support)
•irritability, lethargy, or hypotonia (clinician-defined)
•increase in serum C-reactive protein concentrations to more than 15 mg/L or in procalcitonin concentrations to 2 ng/mL or more
•white blood cells count smaller than 4 × 10⁹/L or greater than 20 × 109/L
•platelet count less than 100 × 109/L
•glucose intolerance (blood glucose smaller than 40 mg/dL or greater than 180 mg/dL)
•metabolic acidosis (base excess less than −10 mmol/L or lactate concentration greater than 2 mmol/L)
We can always debate the relevance of culture negative sepsis, but these criteria are as reasonable as any others (or more-so), and the results for solely culture-positive sepsis are presented as well, as they were an important secondary outcome.
There were 650 episodes of sepsis (confirmed and suspected) and 370 of culture positive, confirmed, sepsis. Episodes were evenly divided between groups, in other words there was no evident impact of the intervention on sepsis. The adjusted risk ratio was 0.95 with lactoferrin, and 95% confidence intervals include a 14% reduction or a 4% increase in all sepsis. Confirmed infection was 17% in each group, RR 1.05, 95% CI 0.87-1.26.
About 2/3 of the confirmed cases were CoNS, there were only 5 total invasive fungal infections, and there was no evidence of any adverse effect of the lactoferrin.
How does this study compare to Manzoni et al? Why might the results be so different?
The control group rate of culture-positive late-onset sepsis is actually quite similar in the two trials at close to 17%, despite the Italian study having slightly smaller infants (they were all < 1500 g whereas 18% of the ELFIN babies were > 1500 g), the gestational ages were very similar. Of course this discounts the infants in the Italian study that only had one culture positive for CoNS (in ELFIN a single culture was sufficient for those infants), so if you add babies who would be considered positive in other studies the proportion of babies with at least one septic episode in the Italian study was even higher. I find this sepsis rate somewhat on the high side for both studies, in the Canadian Neonatal Network the proportion of babies with at least one infection under 32 weeks is less than 10%. (The data available are actually under 31 weeks (about 11%) or under 33 weeks (about 8.5%). The 2 groups of infants 29-30 weeks and 31-32 weeks both had a 3% incidence of sepsis in 2017. The distribution of organisms is somewhat different between the studies, but I don’t think that is enough to explain the differences, if lactoferrin was extremely good at preventing fungal sepsis, and had little effect on other bacterial infections, that might partly explain the differences in results, but only partly. And in fact if you look at the details of the organisms in the report of the Manzoni trial there seemed to be a substantial reduction in gram negative and gram positive bacterial infections, as well as fungal.
Perhaps the preparation of the lactoferrin might have had an impact on its efficacy, the molecule is large and somewhat unstable, impacts on its concentration and efficacy have been noted according to how it is prepared. Heat treatment of stored breast milk markedly reduces lactoferrin concentrations for example, (Li Y, et al. Pasteurization Procedures for Donor Human Milk Affect Body Growth, Intestinal Structure, and Resistance against Bacterial Infections in Preterm Pigs. J Nutr. 2017;147(6):1121-30. Schwarcz WD, et al. Conformational changes in bovine lactoferrin induced by slow or fast temperature increases. Biological chemistry. 2008;389(8):1137-42) and the way it is dried affects the composition of the resulting powder (Wang B, et al. Characteristics of bovine lactoferrin powders produced through spray and freeze drying processes. Int J Biol Macromol. 2017;95:985-94).
Perhaps feeding practices have changed enough that the control ELFIN babies were receiving enough fresh colostrum/maternal breast milk in the first few days of life that there were smaller differences in lactoferrin intakes between groups. Manzoni’s babies started feeds on average between 2 and 3 days of age, increased feeds by 10 mL per day and achieved full feeding by the 12th to 14th day of life. There is no mention of donor milk, the alternative to maternal breast milk appears to have been formula, and preterm formulae contain almost no lactoferrin. The data available from the ELFIN trial don’t have much detail, but about 4% of the infants received formula alone, just less than 70% received mixed feeding, and the remainder exclusively breast milk. A subgroup analysis of ELFIN showed a potential effect of lactoferrin among babies receiving mixed feeds.
As you can see the p-value for the interaction, lactoferrin and type of milk, was not significant, so we need to be very careful making any sort of conclusion, but it is at least possible that there is an impact of lactoferrin supplementation among infants receiving less lactoferrin from breast milk.
Another explanation is that there are biases introduced into either one or other of the trials that had the effect of lactoferrin seeming ineffective in ELFIN, and highly effective in the Manzoni trial, I can’t imagine what those biases may be, but the only other explanation of there being such a difference between ELFIN and the Manzoni trial is random variation, and that the Manzoni trial, a prospective masked multi-center randomized trial with reasonable sample size, was the 1:1000 occurrence of a p-value of about 0.001. I find that explanation extremely unsatisfying.
What should we do now? I think the first priority is to finish any other trials that are in progress, obtain as much information as possible about what seemed to be such a promising intervention. I think that can ethically be justified as there is no trace of adverse effects of lactoferrin in any of the trials to date, it is an intervention with some evidence of efficacy, quite inexpensive, and with a physiologic rationale. Even with ELFIN the results of the trials currently available do leave the possibility of a substantial benefit of lactoferrin supplementation, although the 95% confidence intervals probably do not approach the impact shown by Manzoni. Once all the data are in, a collaborative examination of the data to try to identify the reasons behind these discrepancies, and perhaps design future trials of the most promising product, in the most promising groups of babies.
Babies with postnatal growth failure in the NICU do worse in the long term. This is a statistical association known for a long time. We also know that increasing nutritional intake, in calories and protein can prevent the relative weight loss, but is the association between poorer nutrition and poorer long-term development causative or not?
Average PostMenstrualAge at final measurements (discharge), weeks (SD)
37.4 (4.1)
37.9 (4.8)
NS
Weight at discharge, g (SD)
2525 (746)
2888 (763)
<0.001
Length at discharge, cm (SD)
44.7 (5.4)
46.3 (3.5)
<0.01
Change in body weight z‐score between admission and discharge
−1.03 (0.76)
−0.39 (0.79)
<0.001
Change in head circumference z‐score
−0.6 (1.3)
−0.1 (1.2)
<0.001
Change in length z‐score
−1.7 (1.1)
−1.5 (1.4)
<0.01
With our new protocol, the mean weight z-score decreased much less birth to discharge, and the head circumference z-score decreased almost not at all, but the length z-score still decreased. Very few babies actually fell enough off their curves enough to satisfy definitions of post-natal growth failure, again, if you define by weight. It is clear, despite all that, that the babies are all a bit short and fat when they go home. It may also be that some of the improvement in head circumference is due to subcutaneous fat, so even though I am very happy that head circumference is much better, I don’t know for sure that brain growth is as good as it should be. Making the babies longer as well as heavier is something we would like to be able to do, I think by improving mineral supply, as well as protein intakes, we could probably improve skeletal growth some more.
Which brings us to the thorny question “What should be our goals for nutritional outcomes in the neonatal unit, of very preterm babies?”
There are recent publications with new growth standards, for fetal growth, growth of infants, and growth of late preterm babies, but the data for the very preterm/extreme preterm was quite limited, they are based on “healthy” babies, so of course the numbers of extreme preterms is extremely small.
One of the comments supporting the development of these new standards appears to be that, since we fail to achieve intra-uterine growth, it is not attainable, and we should stop trying, and accept less growth and create new curves. I think that is mistaken,
Until we have other reliable prospective data showing impacts on long-term outcomes of extreme preterm babies, I think the goal of our nutritional interventions should be to aim for the weight, length, head circumference and body composition by 42 weeks PMA that the baby would have had if they had remained in utero with a placenta that functioned well, and then delivered at 39.5 week, and undergone the usual postnatal water and weight loss.
That may be an approach that poses unanswerable questions, but it is the approach taken in a new publication that I only saw after writing that previous paragraph! (Landau-Crangle E, et al. Individualized Postnatal Growth Trajectories for Preterm Infants. JPEN. 2018;42(6):1084-92.) One of the problems with the current best growth charts for preterm babies is that our patients normally cross percentile lines in the downward direction for several days, or even 3 weeks after birth. That is something that we want to happen, as babies who lose less weight have more complications. We can manipulate that weight loss to an extent by starting sodium supplementation too early, for example, but how much free water we give has very little effect.
I have worried for a while about how we could incorporate a curve reflecting postnatal weight loss into a growth chart, and how you would then know which percentile the baby should be on.
This is an extract from the figure legend:
…C) Fetal‐Median‐Growth and Growth‐Velocity Approach. Application of Fenton day‐specific median growth velocities or day‐specific median growth velocities adjusted by a factor from day of life 21 until 42+0/7 weeks (pink). ΔW = difference between target WHOGS weight at 42+0/7 weeks PMA and predicted individual growth trajectory weight…
The authors of this paper have made a number of assumptions, and tested different models to see how they fit. They assumed that by 42 weeks post-menstrual age a preterm baby should be on the WHO growth chart at the percentile that they would have been on had they stayed in utero with a functioning placenta, and then delivered at term and lost their postnatal water, which they term “Contraction of the Extracellular Space” or CES which can be at term, TeCES, or preterm, PreCES. Their preferred model uses day specific corrected median growth velocities from Tanis Fenton’s work, starting after postnatal weight loss, and found that they routinely lined up with the WHO standards at 42 weeks.
They have now set up a website that you can visit https://www.growthcalculator.org that will plot an individualized growth chart if you put in the gestation, sex and birthweight, you can then print it out if you wish. Here is an example showing the curve generated using the criteria shown, and the redlines being the personalized percentiles for that baby.
Using these new weight charts is definitely worth investigating, and I think measures of body composition are important also, even though direct analysis of body composition is tricky, at least an accurate measure of length would be a good idea. Measuring with a tape measure is practically useless; when I was at the Royal Victoria Hospital in Montreal we used a stadiometer, but that requires a fair amount of handling of the baby. Recent studies have used a caliper type of device, and found it quite accurate, and feasible with limited handling. (Pavageau L, et al. Valid serial length measurements in preterm infants permit characterization of growth patterns. J Perinatol. 2018;38(12):1694-701). Of note, the new percentiles that I have been mentioning are not accompanied by length or head growth percentile charts. They also are based an assumption that a baby who starts out at the 1st percentile was destined to end up around the 1st percentile, by 42 weeks; and I am not sure about that, the extremely preterm babies in NICUs are often the result of an intrauterine environment that was poor, and they then are growth restricted. Are babies like that better of if we let them stay on a very low percentile or if we enhance their nutrition and obtain some catch-up growth? Menon and his co-authors in the above-mentioned editorial address briefly some of those questions, and note that the only way to answer them is with prospective trials.