
There are several recent publications about deliveries at 22 to 25 weeks gestation, evaluating the frequency of intensive care support of the babies, factors associated with support, and survival.
The California Perinatal Quality Care Collaborative reports the proportion of “active treatment of infants born at 22-25 weeks of gestation in California, 2011-2018” which also happens to be the title. (Chen X, et al. The Journal of Pediatrics. 2022) it shows that during those years, the frequency of active treatment of babies thought to be 23 completed weeks of gestation increased, a lot.
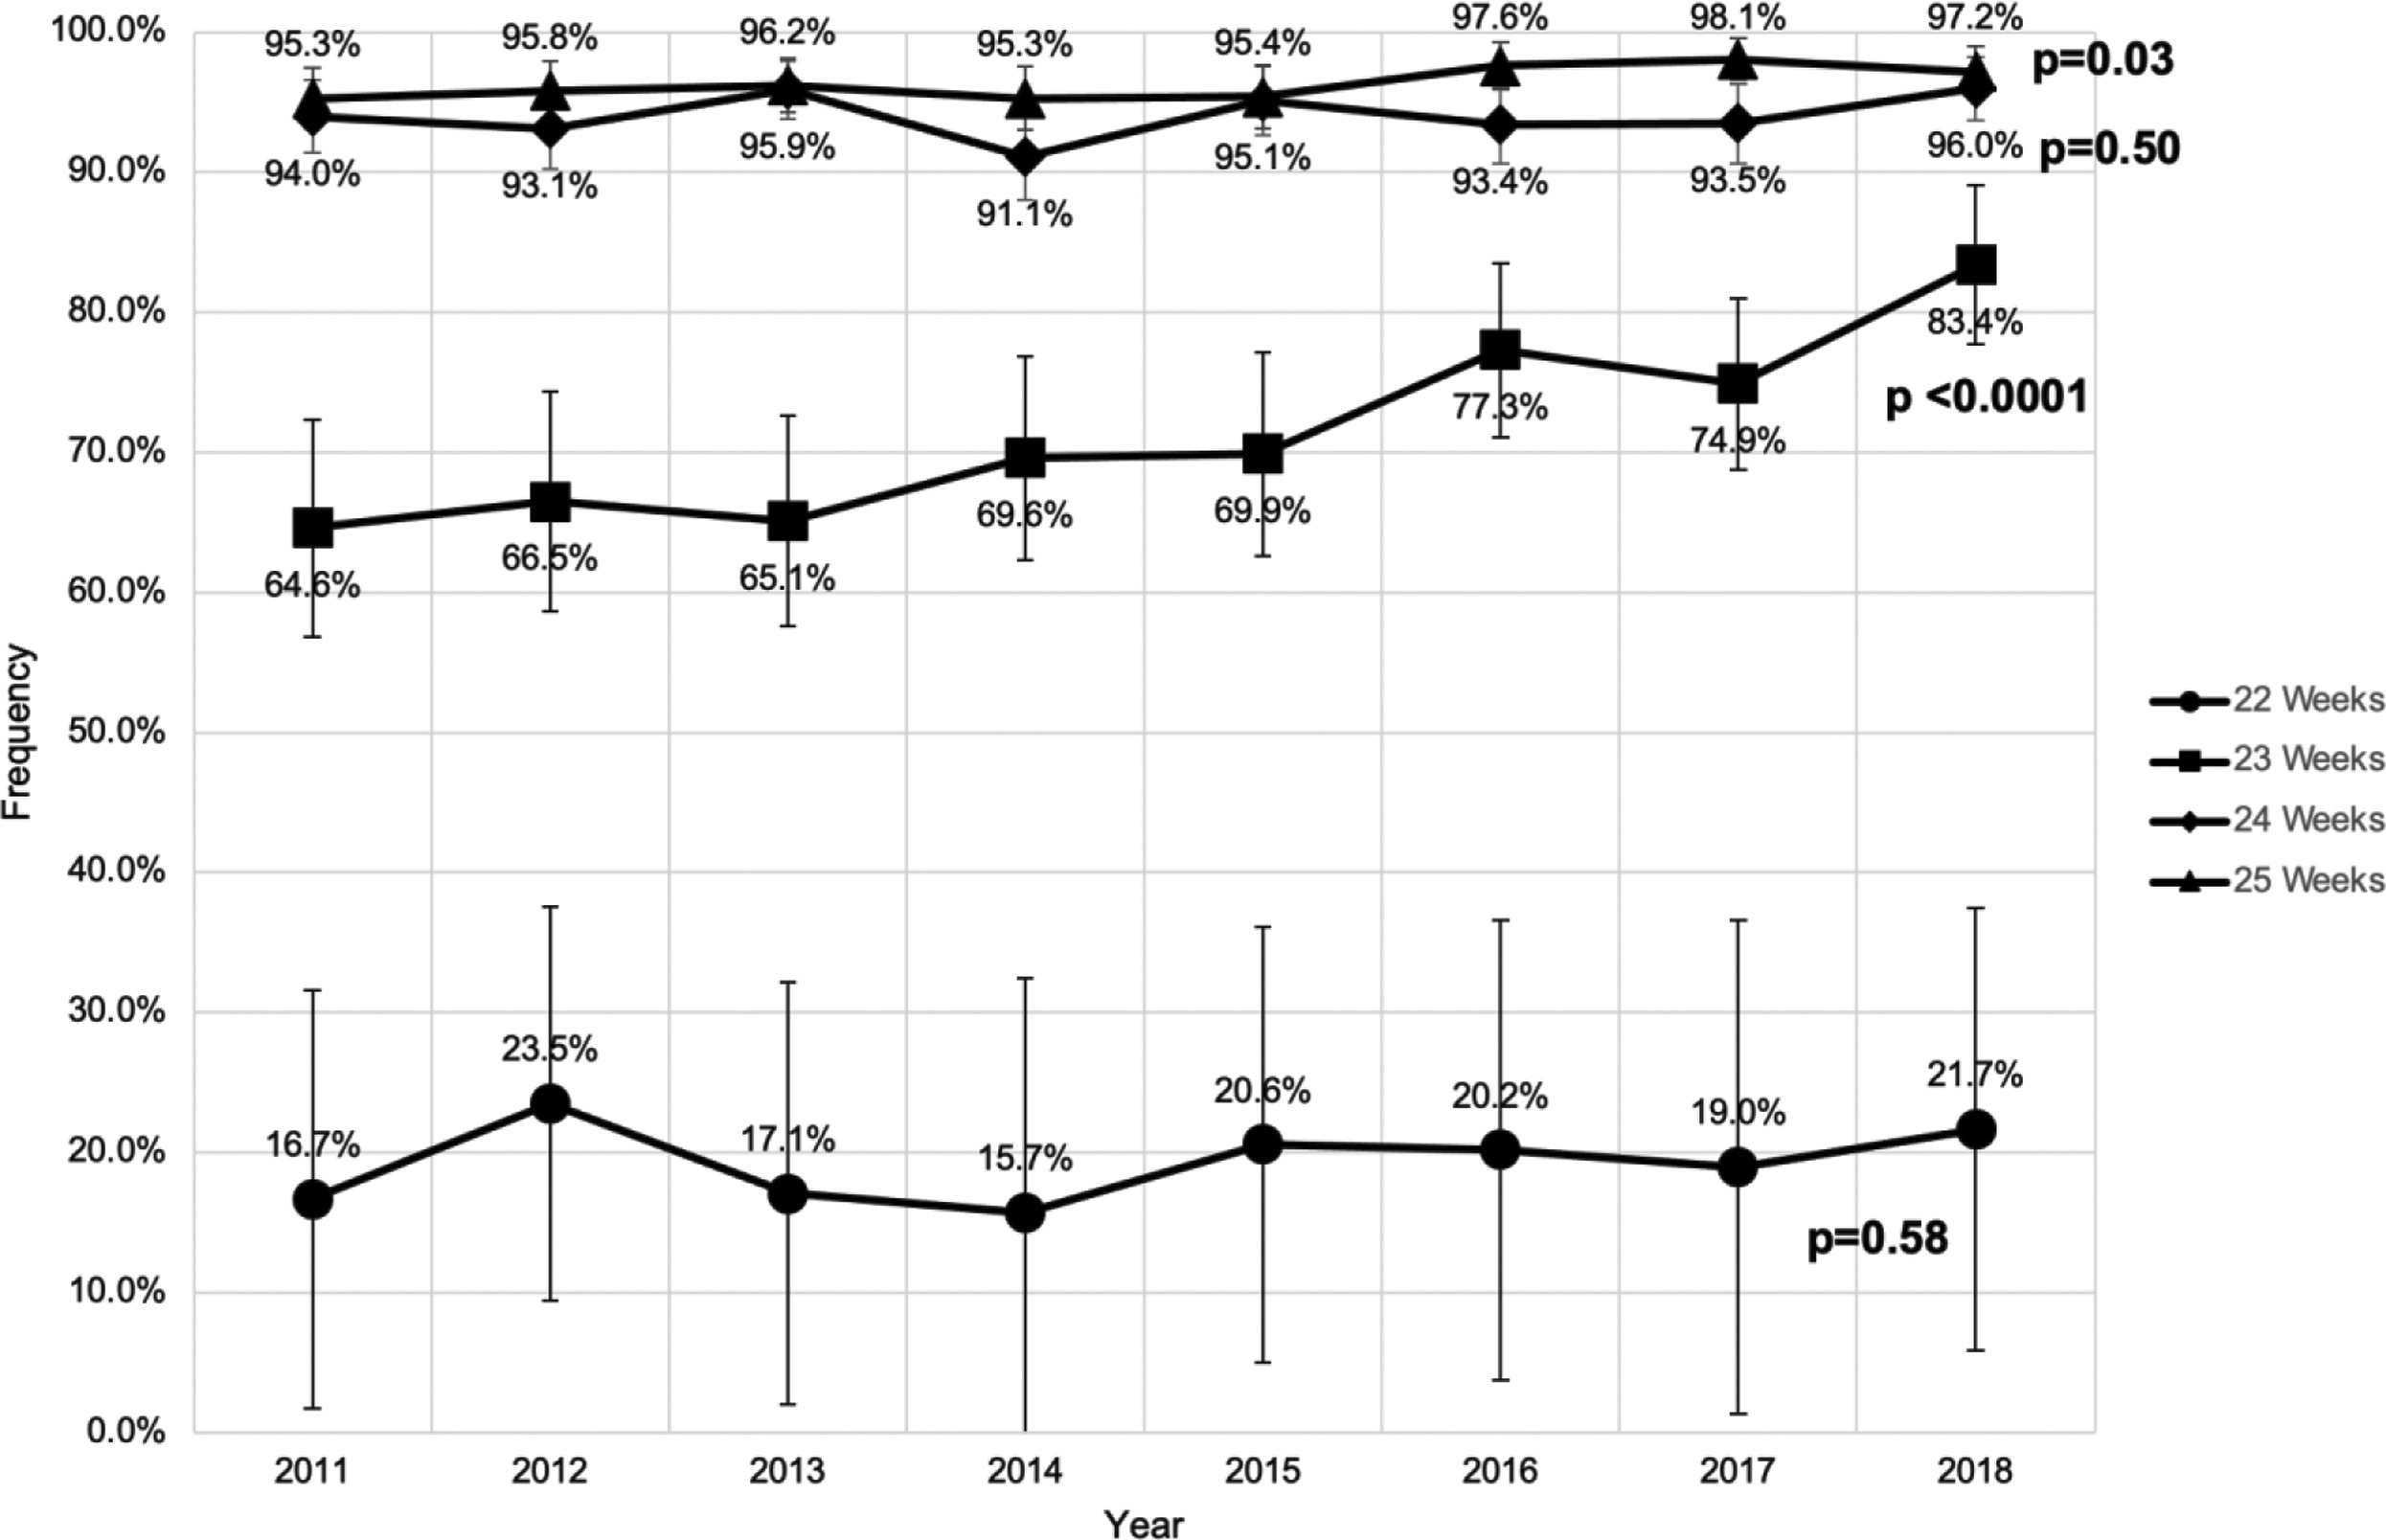
I was a bit surprised by the lack of change at 22 weeks, but there are only about 120 per year, which is why the intervals are so wide, and if you ignore 2012, it looks like there is probably an upward trend; perhaps more recent years will show a change. The CPQCC data collection hasn’t changed significantly during those years, with over 90% of California NICUs contributing, and over 97% of very preterm births included, so the data are very reliable for regional trends.
Another intriguing graph is this one
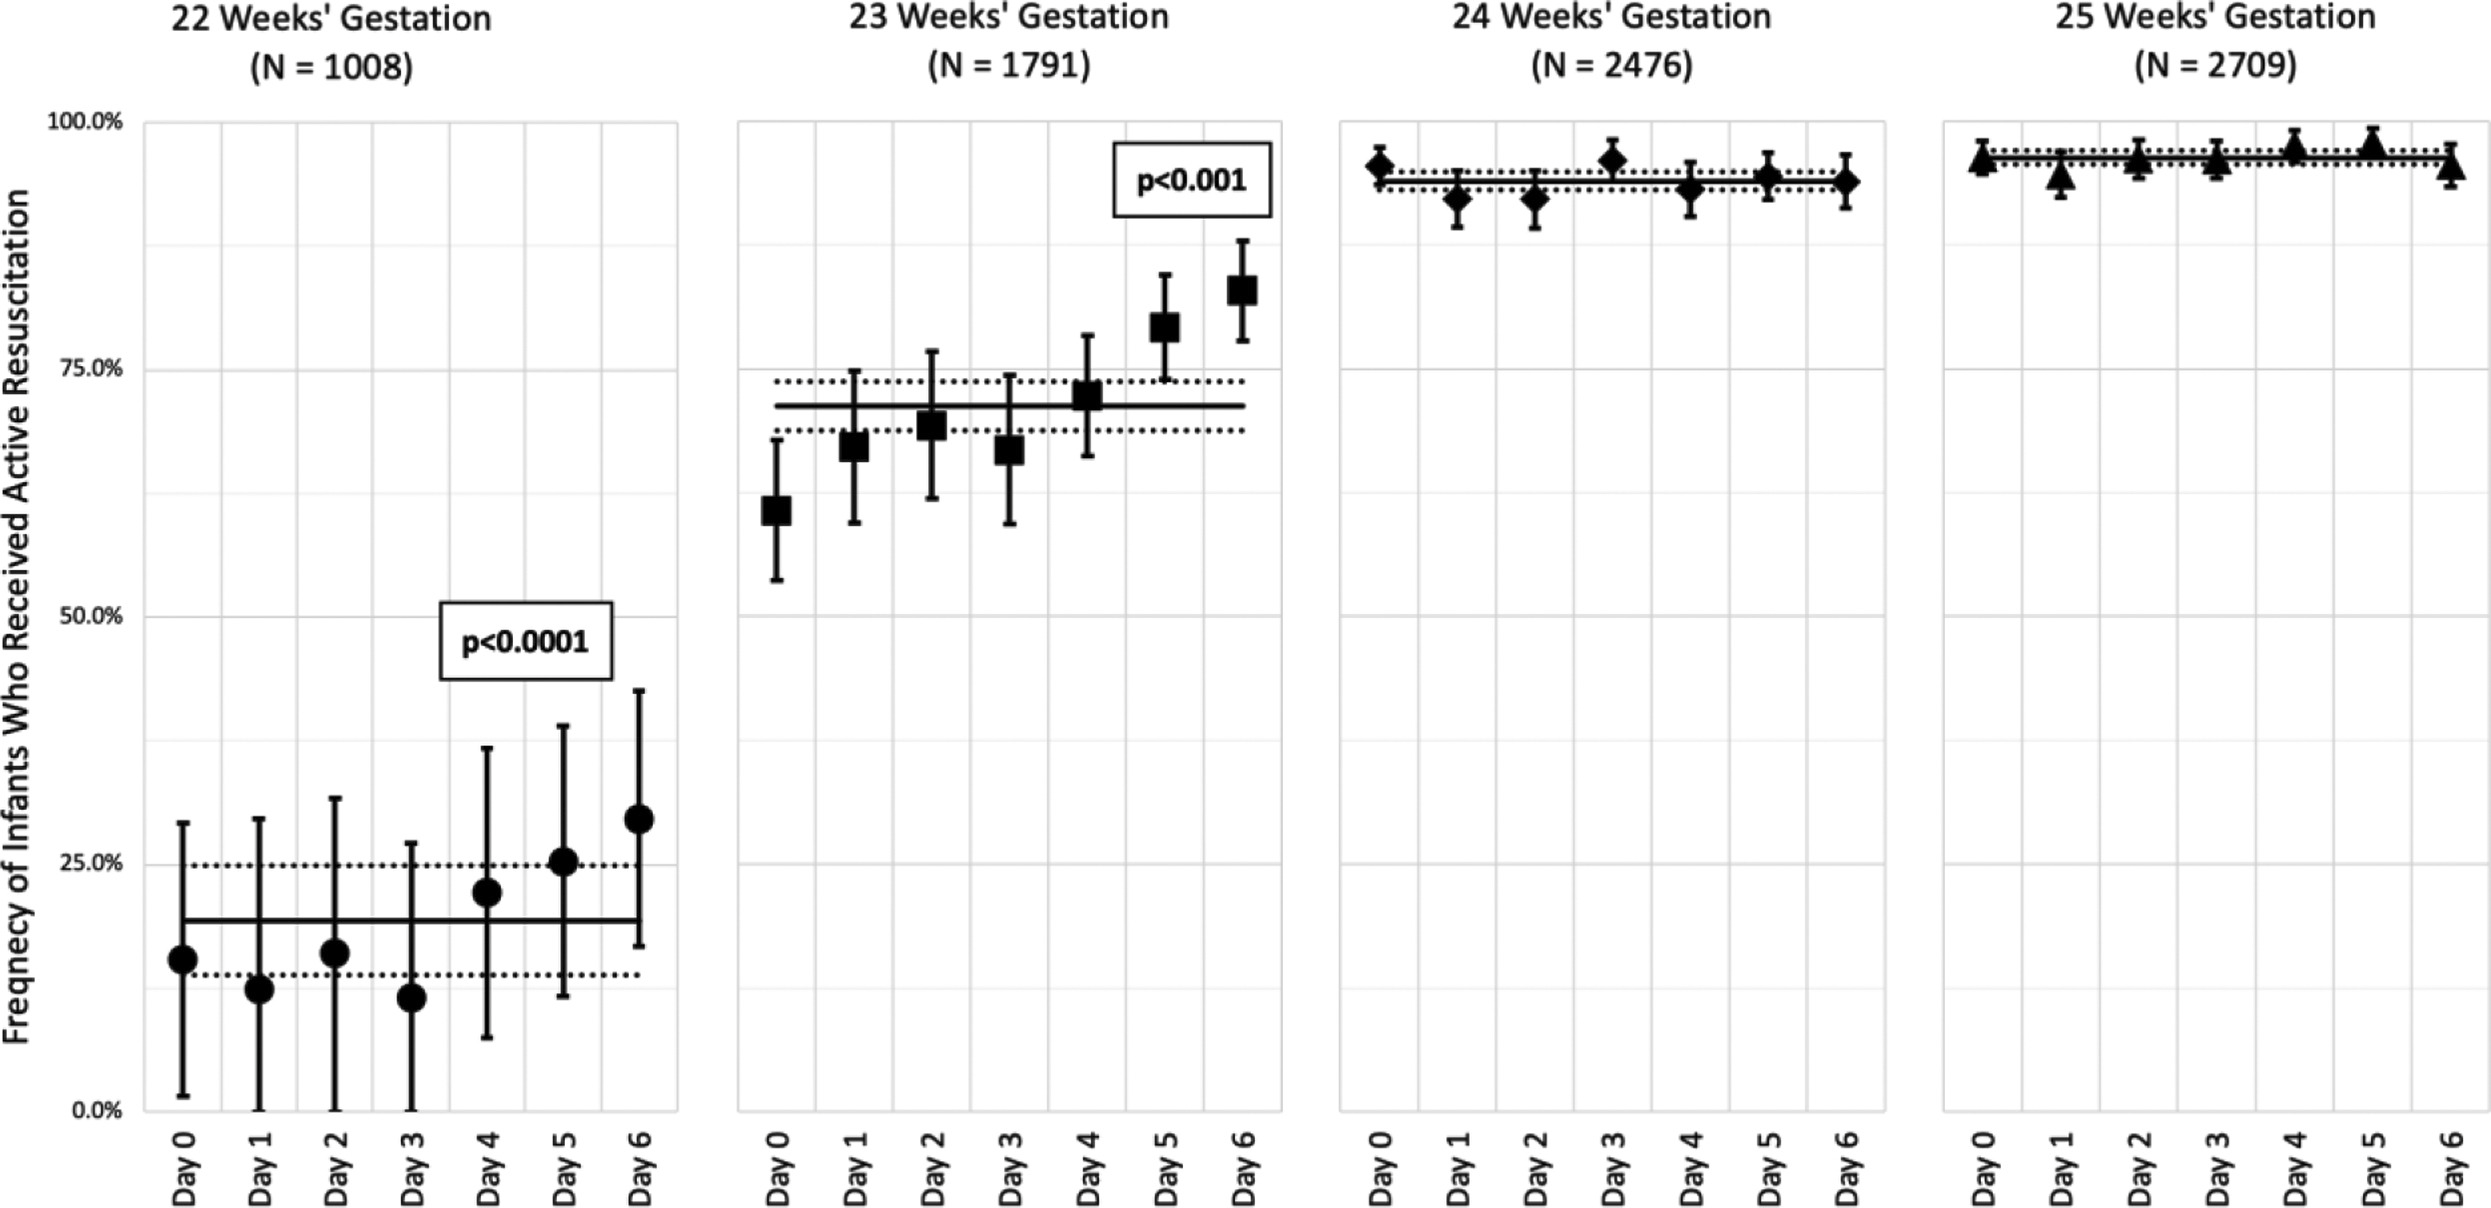
It is interesting, and understandable, that the rate of active treatment increases as the week goes on, from 22 weeks 0 days to 22 and 6, and the same during week 23. What makes no sense, however, scientifically, is the fact that this is not a smooth curve, the difference between 22+5 and 22+6, is so much smaller than the jump from 22+6 to 23+0.
With all the inaccuracies in gestational age dating, the big increases in active care at midnight on day 22+6, and again at midnight on day 23+6 make no sense, and are clear evidence of our preconceptions, I think I will call this the “completed week heuristic”: 22 weeks and 6 days sounds much less mature than 23 weeks, and again 23 weeks and 6 days sounds a lot less than 24 weeks! I hypothesized in a previous post that if human beings had decided a few millennia ago to divide our days into blocks of 10 days rather than 7, our resuscitation patterns would be very different.
Also interesting in this study is that the proportions of babies receiving active intensive care was higher in level 2 NICUs than level 3, which were again higher than level 4 NICUs. The data were analyzed by the hospital of birth, and many level 3 NICUs are associated with a perinatal service, and provide all the care that a level 4 provides except for surgery. It is hard for me to explain why the odds of having active treatment are 34% higher at a hospital with a level 3 NICU at 22 and 23 weeks, and are still 43% higher at 24 and 25 weeks, than a hospital with a level 4 NICU.
The even higher odds of receiving active treatment in a hospital with a level 2 NICU (about twice the odds) are discussed by the authors in the publication, they think that many such babies are delivered rapidly after arrival of the mother, when they do not have time to safely transfer her. As such, there is also less time to counsel the parents, so they may default to initiating intensive care and then transferring.
And what about survival? Well a new publication could have been helpful, but unfortunately ends up being very unhelpful. (Doshi H, et al. National Trends in Survival and Short-Term Outcomes of Periviable Births </=24 Weeks Gestation in the United States, 2009 to 2018. Am J Perinatol. 2022). It analyses data from an administrative database, and reports that there were 71,854 live births in the USA during the years noted in the title, but then ignores all the babies who die at less than 24 hours of life (34,251); I calculated, from the data they present, that the deaths at less than 24 hours were 31,850 babies of 22 or 23 weeks gestation, and about 2,400 babies of 24 weeks. The graph below, like all the others, only includes babies who survived the first 24 hours.
As they give no information about the trends of <24 hour deaths, we don’t know the survival trends among live born babies. Even more annoying, all the data about complications are given as “death or…”, the final figure shows the trends in “death or tracheostomy”, “death or VP shunt” etc. Most of the graphs look just about identical, because death is so much more common than the associated complication, and, as there is no graph for death in that figure, it is not at all clear what the results are for “VP shunt among survivors”, or “tracheostomy among survivors”, which would have been useful and helpful. “Death or BPD” is the one graph which is different, with a much higher percentage of adverse outcomes than the other outcomes, but still, without knowing what the overall mortality is by year, the reader cannot tell if the “BPD among survivors” is increasing or decreasing.
The last of these database analyses (Perry MF, et al. Factors Associated with Receiving No Maternal or Neonatal Interventions among Periviable Deliveries. Am J Perinatol. 2022), looked at the use of antenatal steroids, cesarean delivery and transfer to a tertiary hospital, among mothers who delivered at 22 or 23 completed weeks gestation in the USA. They also examined active interventions for the babies (neonatal intensive care unit admission, surfactant administration, antibiotic administration, or assisted ventilation). The results are somewhat concerning, and reflect, I think, some of the problems in the US medical system, but I also think reflect some cultural variations. Non-hispanic black mothers were significantly less likely to have interventions, which is presented, strangely, as the Odds ratio of having no interventions, which was 1.16 at 22 weeks and 1.21 at 23 weeks. Once born, black babies were less likely to receive no interventions, OR 0.75 at 22 and 23 weeks. SGA babies were more likely to have no interventions and families with private health insurance were also more likely to have no interventions.
When I think of our local practice, I think we also see cultural variations in choices made by and with families from different backgrounds. Parents with some cultural histories are more likely to choose active intervention in the “grey zone” than others, and my guess is, that if we did an objective analysis, we would also see a trend that families with more resources are less likely to choose active intervention. We obviously don’t have families with and without health insurance, this is Canada, we aren’t savages! The discrepancy between maternal and neonatal interventions in this new publication does raise major questions. As an analysis of an enormous administrative database, there are many of those questions that cannot be answered from this data, but they do warrant consideration.
The best outcomes for these babies come when obstetrics works closely with neonatology to co-ordinate active interventions, and ensure that babies who will receive active NICU care are born in the best possible condition. The potential for good survival and excellent long term quality of life is now such that I think I will no longer use the term “periviable”, I am not sure any more what that means, or how to define it.


Yes, Keith, the 1st 24hrs have rarely been studied/reported. But a Dr Molly Pont and I looked at this at Vanderbilt over a dozen years ago. Disparate outcomes were evident at that time.
– Pont, M., Carter, B. Maternal and neonatal characteristics of extremely low birth weight infants who die in the first day of life. J Perinatol 29, 33–38 (2009). https://doi.org/10.1038/jp.2008.112
With regard to Level IV births, I would offer that their delivery rates are often much lower than community hospitals that have a Level III NICU. This was certainly true in Nashville and is true here in Kansas City.