The meaning of life

At the end of the article written by a parent that I blogged about recently, there was a link to their blog. Their latest post is a musing about the answer to the question “what is life all about?” It is very profound, and very simple at the same time, certainly worth reading.


Posted in Neonatal Research | 1 Comment

The Swedish Express

To follow on somewhat from the last post, I wanted to discuss the most recent data from the Swedish EXPRESS study. If you remember, this study has examined the outcomes of less than 27 weeks babies from across Sweden, and has previously shown substantial differences in survival between regions.

One great feature of these data is the inclusion of data from mothers from the time they are admitted to hospital, so stillbirths who deliver at 22 weeks to 26+6 are included. This particular new study concentrates on the data from 844 babies who were alive when their mother was admitted to the hospital. 137 of whom were stillborn. 70% of the live born infants survived to get followed up.

Interventions were variable between regions of Sweden, for example the proportion of babies who were delivered after antenatal steroids varied between regions from 40% to 72%, and cesarean delivery between 29% and 60%. Neonatal interventions were also varied, such as giving surfactant quickly, intubation in the DR, and having a neonatologist in the DR.

The authors created a therapeutic intensity score, and then examined whether being more active improved or worsened survival and long-term outcomes.

The results showed that increasing obstetric interventions increased live birth, and among those born alive, increasing neonatal interventions improved survival. When they examined the infants at 2.5 years, they found that among the survivors, there was no increase in “NDI” with more active care, in fact, what differences there are are in the other direction, fewer babies from highly active regions had “NDI” overall, especially among the 22 to 24 week subgroup, 38% compared to 48%. (NDI was any CP affecting walking, deafness, visual impairment and Bayley 3 below -2SD on any scale, compared to the scores of a local full-term control group).

If you put the 2 outcomes together, the famous “death or NDI”, regions of Sweden that practiced higher intensity perinatal care had significantly less adverse outcomes than lower intensity regions. The Odds ratio for the group as a whole were 0.70, that is, the Odds of having a bad outcome were decreased by 30% in highly active regions, and for the most immature infants (22, 23 and 24 weeks gestation), the OR was 0.43 (0.48 after statistical adjustment) so a greater than 50% reduction in the Odds of adverse outcome, by providing  more active care.

This should comfort anyone involved in care of such infants, if you work harder at getting them to survive, you end up in general with results which are at least as good among survivors than less active centers, at least in the range of actions that were examined in this study.

Here is a very striking figure from that article, showing the survival curves for infants born in high activity, versus low activity regions. The differences are striking. Its hard to imagine any other part of medicine where this survival difference would not be considered to be a major advance.

Express Survival


What were the extremely intensive interventions that were different between the regions? Well, very simple stuff really, its just the willingness to do them that is important

4 key obstetric indicators (delivery at level III hospitals, complete course of antenatal steroids, cesarean delivery, tocolytic treatment) and

4 key neonatal indicators (surfactant within 2 hours after birth, delivery attended by a neonatologist, intubation immediately after birth, infants admitted for intensive care [out of infants alive at 30 minutes after birth])

Of course not all these babies need to be intubated after birth, and it certainly wasn’t 100% in any region (actually varied from 35.6% to 75%), but the difference in proportions of the babies intubated was substantial, showing a greater willingness to do so in some areas than in others.

Posted in Neonatal Research | Tagged , , , | Leave a comment

Before 24

The latest New England Journal of Medicine has a fascinating article the first author of which was a medical student who was working with Ed Bell in Iowa (I say was a medical student as I believe he has now graduated, with an MD and an epidemiology PhD, and is going on to great things in Wisconsin). It recounts the differences in rates of active treatment of babies by their assigned gestational age at birth, and the subsequent survival and 18 to 20 month outcomes, between the hospitals in the NICHD neonatal research network between 2006 and 2011.

Rysavy MA, et al. Between-Hospital Variation in Treatment and Outcomes in Extremely Preterm Infants. The New England journal of medicine. 2015;372(19):1801-11.

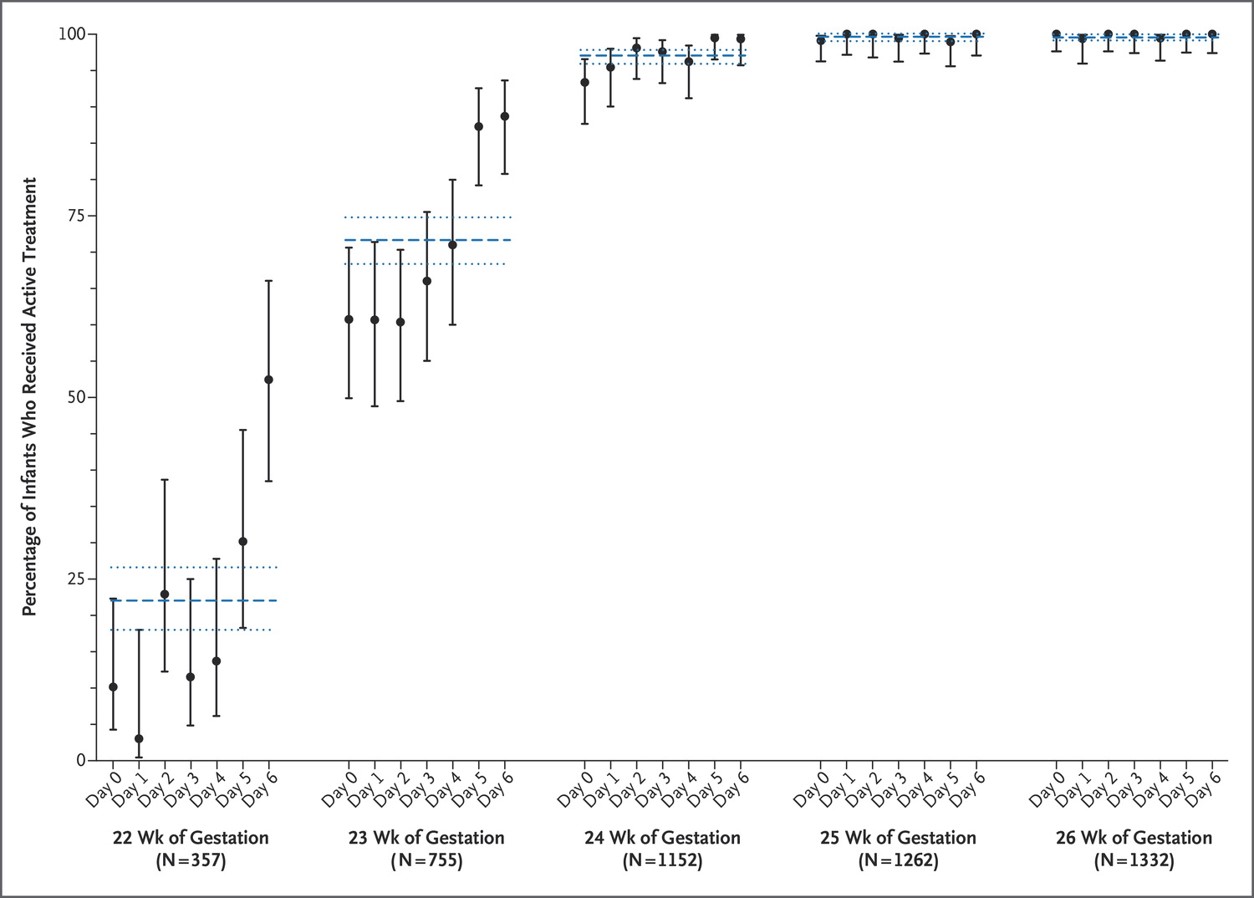
Among the hospitals in the Neonatal Research Network, rates of active treatment at 22 and at 23 weeks GA were very variable. At 22 weeks between 0% and 100% of babies born alive received active intervention, at 23 weeks it was between 25% and 100%. By 24 weeks there was very little difference, 65% in one hospital, but the rest being over 90%. Not surprisingly babies that were so immature did not survive without intensive care, also not surprising therefore, the major factor determining survival was whether or not you were actively treated.

The first interesting tidbit from the results, the frequency of active treatment prior to 24 weeks seems to jump up the last 2 days before the actual week is completed. Many more babies are actively treated at 23 weeks 5 days than at 23 weeks 4 days, and at 22+5, especially 22+6, than at 22 +4.

22 weeks b

At 22 weeks some of the numbers are quite small, with 79 in total getting active intervention, compared to 278 who did not. Survival was 23% for the group overall among those who were actively treated. Six of the 18 survivors had ‘severe NDI’ (‘NeuroDevelopmental Impairment’), 4 of them being a Bayley cognition score under 70, 2 having disabling cerebral palsy. (These numbers are in the supplementary appendix).

This might be repetitive ( I know it is) but a low score on a Bayley evaluation is not an impairment, it is evidence of developmental delay, which may or may not (and often does) catch up in the future. This is still true with the Bayley version 3, as I discussed recently. An impairment is a “loss or abnormality of function”, and I wish the NRN stopped using this term. Disabling CP, death, delay in cognitive or language development, deafness and blindness are all lumped together in the outcome ‘death or NDI’. I don’t think that composite is very useful for parents, nor should it be used for our counseling and decision making with them.

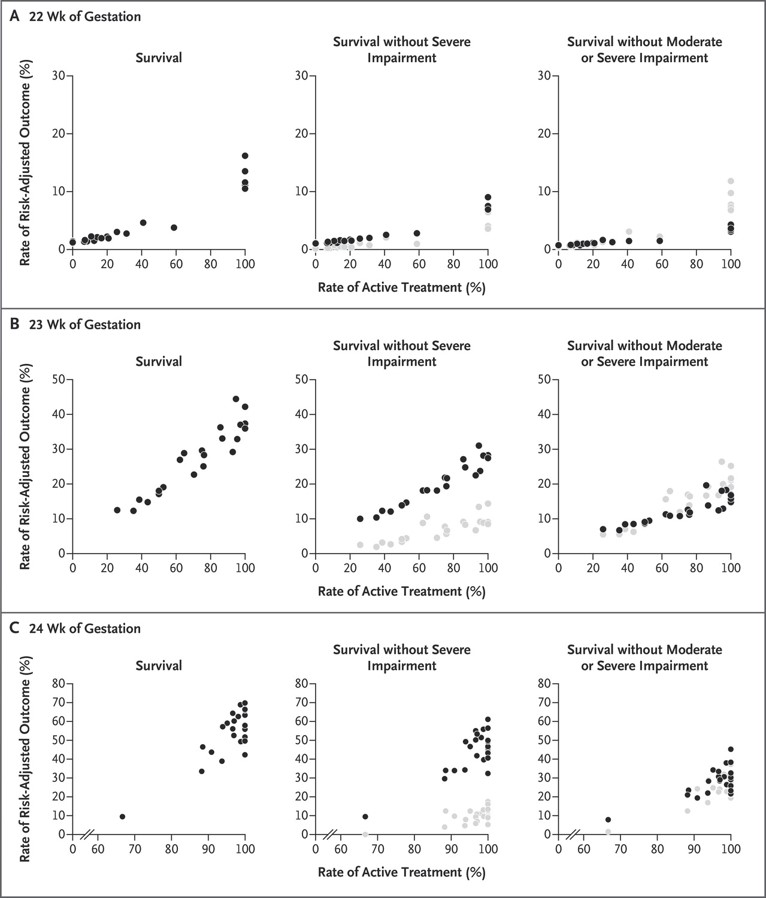
The actual numbers for the individual hospitals are in this figure: It is of interest that the survival at hospitals that treated all their 22 week infants actively are below the 23% I mentioned above, presumably because hospitals that are treating a proportion, but not all, of such infants tend to actively treat infants who are more likely to survive than the average (such as with a higher birth weight, or who have had time to complete steroids).

The legend (slightly edited) to the figure is below.

22 weeks

Relationship between hospital rates of active treatment of extremely preterm infants born at 22, 23, or 24 weeks of gestation and hospital rates of outcomes among such patients. Outcome rates are risk-adjusted to account for differences in infant demographic and clinical characteristics among hospitals. Black dots represent hospital rates of the specified outcome. Gray dots represent the difference between the adjusted hospital rates of survival and survival without impairment and represent an estimate of the adjusted rate of survival with impairment.

It took me a few minutes to figure out the gray dots on the graphs, they are an estimate of the babies who survive with severe impairment or with moderate or severe impairment. (I read it too fast the first time). Most of the ‘moderate impairment’ is a Bayley score between 70 and 84, which has very little significance for long term functioning of these kids.

Jon Tyson has been saying for years, as have we, (and he gave a presentation about this at the PAS meeting that just finished) that our best guess at the fetal gestational age is only one factor that we should be included in our decision-making, and that to have strict rules (even if arrived at by some sort of consensus) based on gestational age alone is irrational.

Part of that irrationality is based on the fact that we never know the GA unless the ovum was fertilized in an assisted reproduction center. The creep up as GA approaches 23 and 24 weeks, is evidence of this irrationality; surely if based on likelihood of survival or ‘survival without NDI’, the frequency of active intervention should increase gradually over the week, and not change as we click past midnight between Thursday and Friday.

Dr Tyson was proposing that we should try and develop thresholds based on predicted outcomes and suggested that we should develop a consensus with parents about which thresholds are appropriate.

I am not entirely in agreement with this approach, especially as his example was to use the composite outcome of ‘survival without severe NDI’.

I think we should be developing methods, along with parents, to ensure that the best decision is made for each family. It won’t necessarily be at the same predicted percentage survival, or ‘survival without severe NDI’ where active intervention becomes the right answer for each family.

I think we should separate the calculation of survival from the discussion of long term outcomes, and that we could investigate, with each family, which outcomes are most important to them, and then try and figure out the likelihood of having, or avoiding those outcomes.

I don’t think that being super precise about the figures is that valuable either: if the risk of death is 21 compared to 31% should that, or would that, make a difference to many families’ decisions? I think the value of the NICHD calculator is to point out the relative importance of non-GA factors, not to give a precise prediction (which is, in any case, already out of date) and then take that figure to the parents bedside, even though that is what is commonly being done (as Bill Meadow’s group showed in an abstract at this years PAS meeting)..

One major missing factor in all this is what I just wrote about a couple of posts ago, the babies who die in utero, because there is no active Obstetric intervention. I know Matt Rysavy is trying to get at this point, but it might be difficult to get good data, unless the NRN starts collecting it prospectively. I wouldn’t be surprised if obtaining this data would make some of the center differences even more striking, as centers with a tendency to actively intervene after birth might also intervene more actively before birth. But maybe not, it would be good to know. Certainly as Neil Marlow notes in his accompanying editorial, the Epicure 2 study showed that “referral to a suitable perinatal center for delivery is a major determinant of survival”.

As John Lantos and Bill Meadow have pointed out, if there was a similar difference between centers in the USA in terms of treatment of other serious diseases (such as metastatic breast cancer as one example), and one center treated all of the patients referred, but another decided that it wasn’t worth it and let them all die, there would be outrage! Especially if some center had long term survival rates of 23%, and others had zero.

Posted in Neonatal Research | Tagged , , , | 1 Comment

How to deal with mortality in Perinatal Research: Part 2

When we consider prospective research, there are a couple of other issues to add into the conundrum.

One is that, as many neonatal deaths follow a decision to limit the intensity of care, any intervention being studied risks affecting decision-making, and thus affecting mortality by an indirect route. This is most likely to be an issue in non-blinded trials, but could potentially be important in blinded trials also.

For example the trials of therapeutic hypothermia were necessarily unblinded, but death in babies with severe HIE often follows a decision to redirect care. As everyone involved in the trials really hoped that therapeutic hypothermia would work, it is possible that decision-making for cooled babies could have been different to controls, leading to a change in mortality. I can’t find any evidence in the published reports that this actually happened, but it is difficult to be sure in the trial reports, as mode of death is not generally described.

It is clear, on the other hand, that since the establishment of hypothermia as standard of care, decisions to withhold or withdraw life-sustaining interventions are occurring later, often after the cessation of hypothermia, and clinical management of these babies is more complex.

As mode of death was not well reported, it is not clear if this might have happened in the trials as well. If it did, however, there were fewer surviving babies with major impairment in the trials, so it probably did not skew the results, or the importance of hypothermia as a therapy. For future research, in contrast, this could be important.

The other big issue in prospective research is that patients who are deceased cannot contribute to longer term outcomes, such as retinopathy or BPD. How should we deal with this? We have traditionally created compound dichotomous outcomes such as : ‘death or disability’ or ‘death or BPD’. But death is truly a dichotomous outcome; impairment is not! According to a lot of prospective research, a Bayley II MDI of 69 is impaired, but 71 is not.

Nor is lung injury dichotomous: Coming out of oxygen at 35 6/7 weeks is not BPD, but at 36 1/7 is?

**UPDATE: after my talk Bob Truog from Boston talked about organ donation and death… his point was that death is not always a dichotomous outcome!

One part of this conundrum is : what happens if the 2 parts of the composite outcome change in different directions?  In the past this was a bit theoretical, as, in neonatology at least, occurrences of reduced death with an increase in other adverse outcomes have been very uncommon.

More recently, SUPPORT (and the other oxygen trials) have to give us pause, as they showed increased death but decreased severe RoP. We should remember that in a strict sense, SUPPORT was actually a negative trial… there was no effect of the intervention on the primary outcome.  Which is the top line in this table, the 2 lines that follow are the 2 different parts of that outcome.support results

Another important issue is that the implication of ‘death or BPD’ is that they are equally important, or ‘death or ‘NDI’’. Even if that is not the intention of the investigators, the fact that a reduction in death may be ‘balanced’ by an increase in the other outcome, and therefore lead to a trial showing a difference in death being a negative trial (because the other part of the outcome changes in the opposite direction), implies that they are equally important.

Also, dichotomizing other outcomes, (which are not themselves truly dichotomous) may miss important benefits. As one example the MoMs trial (of antenatal meningomyelocele closure) showed a substantial improvement in psychomotor developmental outcomes, p<0.03, but there was no difference in the proportion above and below their cutoff.

Does this matter? One result of this trend, sing composite outcomes in research, is that we use them in antenatal counselling : the NICHD calculator, for example, can be used to predict “survival without severe disability”, and, even though it was not necessarily meant to be used for this purpose, many people use this calculation in their antenatal counselling.

I wonder, seriously, is this appropriate? Do death, and survival with severe impairment, have the same implication for a family?

As a ‘thought experiment’ I asked : “How would you react if a doctor told you, when counseling you about abdominal surgery for an intestinal cancer, that your risk of “surviving the surgery without a colostomy” was 60%?”

I think I would like to know rather, how likely is it that I will die? And if I survive, how likely is it that I will have a colostomy?

It would be even worse to be told, “the risk of surviving without “a colostomy, a wound infection, or losing my hair” was 50%”.

But that is what many professional recommendations suggest: to counsel parents about the risk of survival without “developmental delay, blindness, deafness or cerebral palsy”

I finished my talk by noting that epidemiologic and prospective studies that include death as an outcome should quantify the proportions of deaths at each step in the perinatal life trajectory. They should clarify both the causes and the mode of death, and avoid conflating death and other outcomes as if they were of identical significance

Posted in Neonatal Research | Tagged , | Leave a comment

How to deal with mortality in perinatal research: Part 1.

At the PAS-meeting that just finished, we had a very well received topic symposium which was all to do with how death and dying has changed in neonatology over the last decade. My part of the symposium was to discuss death and dying in perinatal research, how to deal with the occurrence of mortality when planning and interpreting research.

I divided the talk into 2 parts, how to deal with mortality in epidemiologic/observational type research, and what to do about prospective studies, including randomized trials. This posting is an edited version of the first part of that talk.

The main points I had to make were that, for epidemiologic research, we have to start earlier in the ‘supply chain’ than the NICU. Obstetric attitudes can affect survival, well before babies get to the NICU, if we make the denominator fetuses who were alive when the mother was admitted to obstetrics, then we get different figures, compared to fetuses born alive, or to babies admitted to NICU.

I gave some references which show both that this is a real effect, and that it is changing over time.

This data for example is from the NICU in Groningen, the Netherlands, presented at PAS in 2012, first author Koper JF.

2001 to 2003 (n=126) 2008 to 2010 (n=113)
Stillbirth, dead on arrival to the hospital 44 (35%) 37 (33%)
Stillbirth, withholding surgical intervention (KJB: mostly C-section) 29 (23%) 17 (15%)
TOP, congenital malformation 22 (17%) 33 (29%)*
Induction for risk of extreme preterm birth 1(1%) 7 (6%)
Withholding resuscitation (comfort care) 25 (20%) 13 (12%) *
Failed resuscitation in the DR 5 (4%) 6 (5%)

and data from our hospital presented at the same PAS by Amélie Dupont-Thibodeau (cohort 1 and cohort 2 are very similar periods to the Groningen data).

 
Cohort 1; n = 166 Cohort 2; n = 298 P value
IUFD (% of total n) 44/166 = 26% 51/298 = 17% 0.0036
IUFD, alive at admission (WH C-section) (%) 29/166 = 17% 21/298 = 7% 0.0004
TOP (%) 67/166 = 38% 167/298 = 56% 0.00045
comfort care: prematurity (%) 26/166 = 15% 36/298 = 12% NS
Comfort care: congenital anomaly (%) 9/166 = 5% 21/298 = 7% NS
Failed resuscitation (%) 0 2/298 = 1% NS

Changes in obstetric approaches, due to changes in obstetric attitudes and the results of parental counseling, have significant effects on who is born alive. Once born alive, infants will get to the NICU if active, curative, care is instituted, there are very few failed resuscitations, almost all deaths in the DR are due to a decision to withhold, or limit resuscitation.

Neonatal attitudes and training also affect survival, but not just in neonatal survival, also in who is classified as a live birth. Wally Carlo et al’s research on Essential Newborn Care showed a decrease in still birth rates, clearly this is a result of personnel in the delivery room recognizing that some infants they thought were stillborn were actually viable, if they received active care. This effect would not have been seen if the group had not collected stillbirth rates. Similarly, comparison of different hospitals in our large databases, even when we are comparing outcomes of very immature babies, not the term and late preterm babies in Carol et al’s study, are affected by who is considered a live-, or a still-birth.

Here are the data: before “Essential Newborn Care” 23 per 1000 stillbirths, afterward 15.9 per 1000. RR 0.69 (95% CI 0.54-0.88). (Carlo WA, et al. Newborn-care training and perinatal mortality in developing countries. The New England Journal of Medicine. 2010;362(7):614-23.)

Nick Evans made a point, during our question and answer session, that babies who deliver in peripheral hospitals, because a decision was made not to transfer the mother, may also be a significant contributor to mortality. The proportion of potential very preterm babies affected could well differ from one region to another, so collecting regional data, which includes mothers whose babies were alive at (for example) 20 weeks, and who deliver a live- or still- born baby at extremely preterm gestations is important in order to be able to make valid comparisons.

Once babies arrive in the NICU, our problems are not finished.

In order to be able to continue to improve outcomes of the NICU, we need to know what causes of death are most frequent, so that we can then direct our energies at attacking those causes. But in recent publications, (from the NICHD network, from Pediatrix and from the German Neonatal Network, for example) the causes of death are not always clear, by which I mean that CNS injury, as one example is often listed as a cause of death. But in the very preterm, brain injury very rarely leads to physiologic instability and death. The usual sequence, in contrast, is that a head ultrasound shows a serious bleed, which leads to a discussion about long term function, and then withdrawal of life-sustaining interventions. In contrast, sepsis may lead to profound physiologic disturbance and thus to death by a more direct route, and necrotising enterocolitis might lead either to a discussion about whether surgery is appropriate, or to critical illness (or both). The ways to address these complications of prematurity change depending on the pathway to death.

These pathways may also be very different between one hospital and another. So in one center they may almost never have ‘death due to IVH’, not necessarily because they have discovered how to prevent it, but because they are skeptical about the predictive value of early head ultrasound. Another center might have less death due to NEC, as they routinely go to surgery, but have more deaths due to sepsis, as there are more babies with central lines for a longer time.

In order to have valid comparisons, and to decide how to improve our outcomes, we need to know, not just the cause of death, but also the mode of death.

This data from Edouard Verhagen and his collaborators show how these approaches can differ between different NICUs. (Verhagen AAE, et al. Categorizing Neonatal Deaths: A Cross-Cultural Study in the United States, Canada, and The Netherlands. The Journal of pediatrics. 2010;156(1):33-7.)

Intervention Physiology Groningen (n = 68) Montreal (n = 43) Wisconsin (n = 43) Chicago (n = 29) Total
Died in DR
Category A, died while receiving CPR Unstable 0 0 3 (7%) 0 3
Category B, withholding CPR, comfort care Unstable 16 (24%) 9 (21%) 4 (9%) 0 29
Died in the NICU
Category A, died while receiving CPR Unstable 3 (4%) 5 (12%) 4 (9%) 9 (31%) 21
Category B, withholding CPR, died on the respirator Unstable 1 (1%) 1 (2%) 0 5 (17%) 7
Category C, extubation to let the moribund child die in parents’ arms Unstable 35 (52%) 13 (30%) 17 (40%) 15 (52%) 80
Category D, elective extubation for quality-of-life reasons Stable 13 (19%) 15 (35%) 15 (35%) 0 43


The approach is also interestingly variable between the NICU and the PICU, even when they are separated by a single floor in the same establishement, here again are data from our hospital (Fontana MS, et al. Modes of Death in Pediatrics: Differences in the Ethical Approach in Neonatal and Pediatric Patients. The Journal of pediatrics. 2013.)

Intervention Physiology PICU (n = 68), n (%) NICU (n = 77), n (%) P value
Died with CPR (no WH or WD) Unstable 4 (6) 5 (7) NS
Died on ventilator (WH CPR, no WD) Unstable 35 (51) 4 (5) <.05
WH/WD (moribund children) Unstable 18 (27) 27 (35) NS
WH/WD (for QOL reasons) Stable 11 (16) 41 (53) <.05

The conclusion of this part of the talk was that for epidemiologic studies :

  • Reports should include all babies who eventually delivered at very preterm gestation (either alive or stillborn); and specify:
  • How many were alive when the mother was admitted to obstetrics.
  • How many were terminations of pregnancy for anomalies
  • How many were terminations of pregnancy/inductions of labour for threatened extreme prematurity
  • How many resuscitations not attempted for extreme prematurity
  • How many failed resuscitations
  • How many admissions to the NICU
  • How many deaths in the NICU
  • Causes and modes of death in the NICU
  • Only by reporting how the numbers change between admission of the mother, delivery of the baby, admission to the NICU, and discharge can we have valid comparisons that will allow us to move forward.
Posted in Neonatal Research | Tagged , | Leave a comment

A Parent writes in the BMJ

Published today, a brief article by a parent of a child with trisomy 18. Please read it, it won’t take more than a few minutes, but it could make a difference to how you interact with the next parent who has a baby with a serious condition.

I hope Alison Pearson and the BMJ won’t mind if I give you a taste of her advice to medical staff, in case the article isn’t freely available everywhere.  I have shortened and edited her ‘bottom line’ but, if you have access, the longer complete versions are worth reading and taking to heart.

  • Be aware of your ability to create self fulfilling prophecies. It is easy to limit a child’s chances by being pessimistic about what they will or won’t be able to do in the future.

  • If you need to ask about a ‘do not resuscitate’ decision, discuss it once and then record the response.  It is definitely not a “tick box” question to be asked routinely at every admission.

  • Don’t try to destroy a family’s hope. There is no such thing as “false hope” whether or not it comes true, it can help today to be manageable

  • Remember that parents need help too, not just babies and children. It helps when healthcare workers treat our children as though they will recover, rather than assuming that they won’t.

  • Acknowledge that our children are beautiful, happy, and much loved;  be pleased by their progress, and give us good news, as well as bad.

  • Using terms such as “dysmorphic features” and a “lethal condition,” as well as talking about her “end of life pathway” in front of our children and their siblings is simply not respectful. Think carefully about the words you choose to describe children to their parents, and in the presence of siblings.


Posted in Advocating for impaired children, Neonatal Research | Tagged , | 4 Comments

Profiteering from sick patients

I strongly recommend the blog of Richard Lehman at the BMJ. Each week he surveys the major general medical journals, and provides insightful commentary (e.g. on mesothelioma explained), which is always perceptive, and often bitingly funny and critical. His hilarious comments about naming of antibody based medications, from this weeks issue, and recent comments about the successors to statins (he has claimed copyright to naming them ‘fatins’) are typical. This week he starts off:

Last week, dear friends, we kicked off with alirocumab and evolocumab. This week it’s the turn of nivolumab, ipilimumab, and pembrolizumab. It’s driving me mab.

I wanted to discuss today another issue that he has written about:

When penicillin was first produced in Oxford in 1940, it was life-saving and literally priceless. But soon Norman Heatley invented a way of producing a few grams of it using bedpans and milk bottles, and in 1941 he travelled to the USA to persuade Merck to mass-produce it. There was no question of a patent. Within a few years, penicillin had become one of the cheapest yet most valuable drugs. Now when monoclonal antibodies first appeared in the 1990s, they were rare and expensive. Hundreds have since been patented, and they remain eye-wateringly expensive—£75,000 is the UK cost of a course of ipilumab, for example. The ones we have been discussing this week are last-ditch treatments for aggressive disseminated cancers. Are we to believe that there have been no production advances which could have brought down costs for all these izumabs and ilumabs and olumabs? That £10K per month of postponed death will forever be the fixed price that manufacturers can reasonably demand? I’d be for calling their bluff. There should be an international production facility for producing monoclonal antibodies at cost for use in cancers and for carrying out independent, rigorously conducted trials. The present system is a blot on medicine.

I think we need to go much further than this, for the problem is not just with monoclonal antibodies, but with all new molecules coming to market. Pharmaceutical companies in general price new medicines, not according to some reasonable calculus of cost of production, recuperation of development cost, and a profit margin, but by asking “what is the highest price we can possibly get away with?”

Which means that new medications are all horrendously expensive, even if relatively cheap to produce, and even if the initial R&D costs were funded publicly (as for example inhaled NO and AZT for AIDS). In neonatology we have been a bit sheltered from some of the worst excesses, because our patients use small volumes of any drug. Molecules developed specifically for newborn infants, however, can often be very pricey, such as surfactants, inhaled NO, and intravenous ibuprofen.

I have great fears that any new molecule (lactoferrin? IGF?) specifically developed for preterm babies will end up being ‘eye-wateringly’ expensive also, and that we will have to make choices about what other things we will cut from our budgets (breast-feeding support? Assistance to families?) in order to pay for them.

Posted in Neonatal Research | Leave a comment

Bayley, Bayley, Bayley

That is, Bayley 3.

Back from the PAS-meeting, followed by a resuscitation research workshop, and suffering from brain fatigue.

One thing that fatigues my brain is a statement that I heard more than once which is that the version 3 of the Bayley scales exaggerates the performance of very preterm infants.

I think that is an erroneous interpretation of what we know.

The 3rd version of the Bayley scales of infant development give higher scores, when administered to the same preterm infants, on the cognitive scale, compared to the MDI on the Bayley 2. Of course the Bayley 2 did not have a language sub-scale, language skills were incorporated into the MDI. That doesn’t necessarily mean that the Bayley 3 is over-optimistic.

Some of this is a question of terminology; for example, Peter Anderson, and the amazing Victorian Group from Australia, published an article which they titled ‘Underestimation of Developmental Delay by the New Bayley-III Scale‘. Their title and analysis are true in so far as the definition of developmental delay is : a score more than 2 SD below the age-matched full-term controls with birth weight over the 10th percentile who consented to be part of the study. Even if the controls who participated (92% of them) are representative of the whole population, eliminating late preterms (8 to 10% of the population), and growth restricted babies (10% of the population) will inflate scores a little compared to a completely unselected population. It is also possible that normal birth weight full-term babies with difficulties might have self-selected to not participate, but that is not sure. In that study, the numbers of babies with a score less than 70 was much lower than the number with a score below -2SD, because the mean score of the controls was about 108 for both cognitive and language, with an SD of about 14. So 2 SD below the mean of the controls was about 80 on each scale.

The mean score of this control sample was well above 100 partly because of the factors I’ve just mentioned, but also because the standardization of the Bayley 3 tool included adding 10% of infants with behavioural, developmental, and physical issues to the standardization group.

If you want to identify children with a score lower than -2SD below a sample of non-growth restricted full term babies, then you need to do what Anderson et al did, and have such a control group. In that sense the title and implications of their study are correct.

Another way of looking at it though, would be to ask if the Bayley 3 can identify infants who will have problems later, or if it can identify infants who will benefit from intervention.

A good step in this direction has just been made by the same group, who have compared Bayley 3 cognitive and language scores to an IQ type test at 4 years of age, (the DAS-II, apparently a test of reasoning and conceptual abilities).

One example of their results is this scatterplot:

Bayley 3

Which shows the (non)-relation between the 2 y Bayley 3 cognitive score and the non-verbal reasoning score on the DAS-II. As you can see there is a positive correlation, but there is also a major spread on either side of the line. I can see only one baby with a DAS less than 70, who had a Bayley 3 of 70. The remaining Bayley 3 scores that were below 80 are all in the ‘normal range’ at 4 years on the DAS.

The graph comparing Bayley 3 language scores to the language subscore of the DAS-II is even more striking, The correlation between the Bayley 3 and the DAS is very poor, the line is almost horizontal. Bayley 3 language

At 4 years the non-verbal reasoning score of this group of preterm infants of less than 3o weeks gestation was 99.9. Low Bayley 3 scores were very poor at predicting who would have low DAS scores, positive predictive values were all less than 50, even when using local reference data, and using a more severe cutoff.

This means 2 things,

1. We still can’t use the 2 year Bayley scores (even the Bayley 3) to define who should be considered impaired, most babies with low scores do not have low cognitive abilities later on.

2. The Bayley 3 is not sufficiently predictive to use to determine who should have further follow-up or intervention. The negative predictive values were very high though, so an infant who scores well on the 2 year Bayley-3, will probably continue to score well later on.

Posted in Neonatal Research | 1 Comment

Not neonatology : Penguins! Honey Buzzards! Ospreys! Also Herons! Even Parrots!

I have added a photo page of California birds, with pictures from my 2 recent visits to San Diego. Just place your mouse on ‘photos’ above, then click on the Gallery that you want to see.

For those of you who have previously looked at my wildlife photos, you may also be interested in this website: some excellent photos of penguins, by a photographer who is really dedicated to this particular group of birds. The photos are great, group views, close-ups, and many that really show you something new about their lifestyles.

Also I noticed this fascinating video showing a reconstruction of the Migration of Honey Buzzards from Holland to West Africa.

I just returned from the PAS-meeting in San Diego. followed by a resuscitation workshop held on Shelter Island. As well as hearing some great presentations at the workshop, and having excellent interactions with many investigators, there is a nesting platform which was erected just 400 m from the hotel on Shelter Island where we were staying. A pair of Ospreys have raised some chicks there, one of whom decided to flap around and land on the back of a long-suffering parent. (click to see larger version).

1D8A5074

Also Herons on the boat dock, in this case a Great Blue Heron

Great Blue Heron


Finally, although I lived and worked in San Diego for 4 years, I don’t recall having seen parrots while there. These are probably originally an introduced species; they are fun to see, but make a great deal of rather raucous, fairly unattractive, noise. These are Red-crowned Parrots, they are, in fact, native to North-Eastern Mexico; but it is thought that the southern California birds are there because of humans transplanting them.

1D8A5025


Posted in Neonatal Research | Leave a comment

Sense about Sepsis

Recent guidelines regarding the evaluation and treatment of early onset sepsis, or the baby who has risk factors, have been widely criticized.

Especially by me! And by me!

The AAP for example recommends antibiotic treatment for all infants born after a maternal history of chorioamnionitis. The statement I wrote for the CPS a few years ago in contrast, did not. We recommended a CBC and close observation alone in infants who had a history of chorioamnionitis, but appeared well. This was based on an incidence among well-appearing infants after an obstetric diagnosis of chorioamnionitis of well below 2%. Of course it is not zero, as babies who look OK at birth might be in the early stages of infection and become sick later. Also there are big problems in the diagnosis of chorio, even in the papers that we cited to make our recommendation.

When we made our recommendations (2007), the difference of opinion with the AAP and the CDC was understandable, there were many unknowns based on the limitations of the data; the AAP/CDC approach was based on a fear of missing real cases, ours was based on a fear of massive over-treatment of relatively low-risk patients (although, of course both ‘sides’ were fearful of the other issue as well).

Now there is a lot more information, and a new publication from 2 of the authors of the most recent version of the AAP recommendation, along with James Wynn, makes some recommendations based on those new data. I think at last (and this is not surprising, given that the first author is the always excellent Bill Benitz) that these recommendations are sensible, reasonable, and likely to do the least harm to the largest number of babies.

They say the following (I have skipped a couple which were of less day to day value to working paediatricians) (EOS is early onset sepsis):

 2. Infants who exhibit persistent, progressive, or moderately severe to severe clinical signs consistent with EOS should receive empiric antibiotic therapy after cultures are obtained. Infants with mild-to-moderate respiratory findings (flaring, grunting, retractions, or tachypnea) immediately after birth may be monitored closely for resolution of transitional behaviors, without initiation of antibiotic treatment unless signs worsen or persist for more than 6 hours.

4. Preterm infants (<34 weeks’ gestation or <1500 g) are at significantly increased risk for EOS…, it is reasonable to continue to stratify risk based on those traditional risk factors. Because most preterm infants have clinical signs of illness, most will qualify for empiric treatment. Preterm infants who appear well and have minimal or no risk factors (eg, no chorioamnionitis, preterm premature rupture of membranes, or GBS colonization with inadequate intrapartum prophylaxis) may be candidates for close monitoring and serial laboratory evaluation.

5. Well-appearing late-preterm and term infants should be managed with close clinical observation, because of the low sensitivity of risk factors in ascertainment of EOS in this group. Efforts to improve ascertainment of EOS cases in this population are commendable, but should not obscure the limited utility of the strategies attempted to date.

6. Even with selective treatment strategies, most treated infants will not have bacterial infection. In treated infants, serial normal diagnostic tests, such as blood counts or C-reactive protein levels, are highly predictive of the absence of infection and should be relied upon (in addition to culture results) to minimize the duration antibiotic exposure. However, isolated abnormal hematological or acute-phase-reactant measurements should not justify continuation of empiric antibiotics for more than 48 hours in well-appearing infants with negative culture results.

I agree totally!

Which is unusual!

I should cut down on the exclamation marks!

The analysis of clinical signs, and that modest respiratory signs can be followed, is a welcome improvement, as are the recognition of the importance of persistently negative lab findings, and the lack of importance of positive lab findings.

UPDATE** after further reading, I have to change this to I agree ‘almost totally’. #4 implies, if I read it right, that preterm babies with serious respiratory illness should all get antibiotics, even if there are no risk factors. But for preterm babies born after c-section for maternal indications with intact membranes and no labour, the risk of sepsis is very close to zero, even if they have serious respiratory findings. This is a substantial minority of our preterm babies and they can safely be managed without blood culture or antibiotics.

I think we should now be able to go forward to an international consensus, based on good data, which will avoid over-treatment of low-risk patients but also ensure that almost all truly septic babies receive timely care.

Posted in Neonatal Research | Tagged , | Leave a comment