In case you remember my little Survey Monkey questionnaire on pressure volume loops, and were wondering about the responses, there were about 100 people who wasted a few minutes on the survey. Most were from medical professionals, (mostly neonatologists and fellows, but also residents, nurses and a few RTs) almost all were from centers that currently use ventilator graphics in managing their patients.
So I selected just those medical professionals that currently use graphics in their practice, and, as I expected, there was no consistency whatsoever in their evaluation of the curves. For example, the last curve was considered to be needing an adjustment by 85% of the respondents, 56% thought it was over-distended, and needed some sort of reduction in ventilation assistance, 28% thought it was under-inflated and needed an increase in ventilation assistance. Here is the loop:
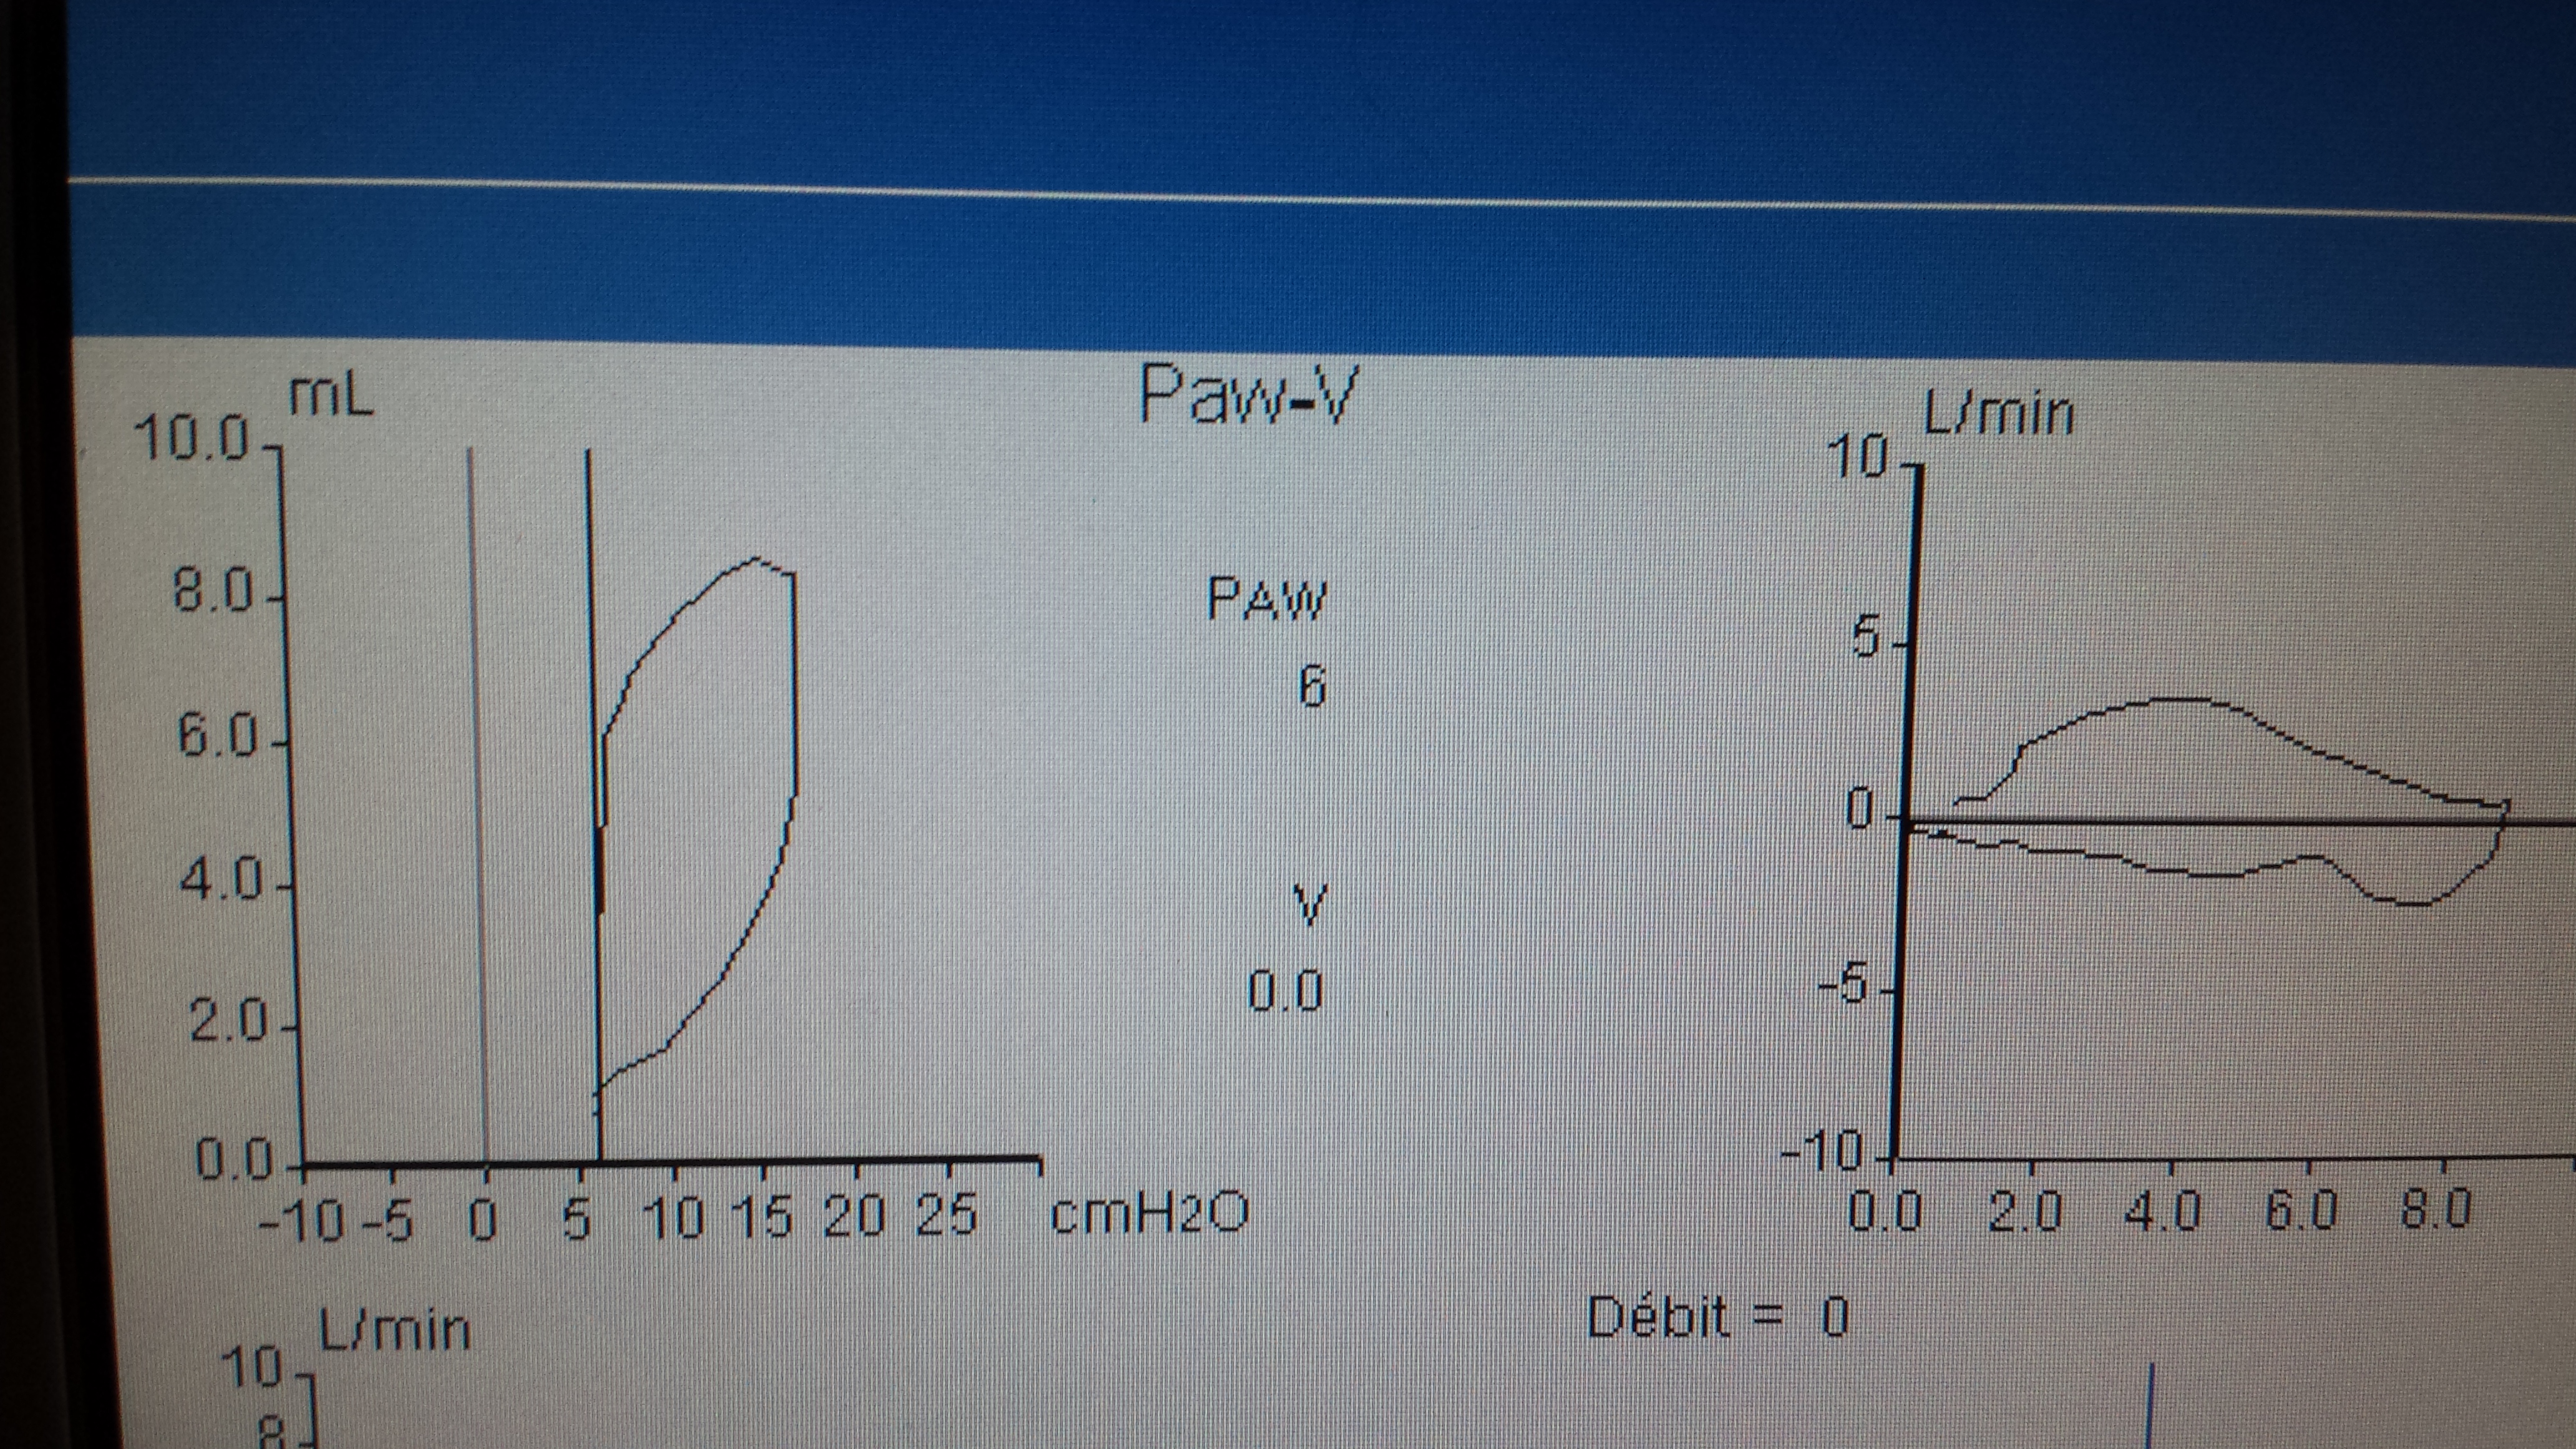
And here are the answers:
Choix de réponses– |
Réponses– |
|---|---|
|
It shows over-distension and I would reduce the set volume
|
40,48% |
|
It shows over-distension and I would reduce the PEEP
|
16,67% |
|
The loop is perfect, I would make no changes
|
14,29% |
|
It shows under-inflation and I would increase the set volume
|
9,52% |
|
It shows under-inflation and I would increase the PEEP
|
19,05% |
I looked at those responses from people who did not use graphics, and they were about the same.
Makes you think…