My readers are a highly educated bunch and I am sure that the anglophones among you will recognize that title as a bastardized quotation from “Animal Farm”. Not my favorite of George Orwell, a bit too obvious as an analogy for my taste, but influential none the less.
This article should also be influential: Tingay DG, et al. Are All Oscillators Created Equal? In vitro Performance Characteristics of Eight High-Frequency Oscillatory Ventilators. Neonatology. 2015;108(3):220-8. What David and the group have done, in a circuit with a lung model, is to look at how well various oscillators perform, they compared set amplitudes to actual delivered amplitudes, in the ventilator circuit, and in the test lung, and then how that translated into tidal volumes. They also looked at how volumes were affected by changes in frequency, and how the volumes and amplitudes were affected by ETT size (2.5 or 3.5 mm).
These data need, I think to be compared and integrated with 2 other publications from the same group:
- Harcourt ER, et al. Pressure and flow waveform characteristics of eight high-frequency oscillators. Pediatric critical care medicine. 2014;15(5):e234-40.
- John J, et al. Drager VN500’s oscillatory performance has a frequency-dependent threshold. J Paediatr Child Health. 2014;50(1):27-31.
The best way to understand the data is just to look at some of the figures.

This first one (figure 2 from the article) shows the actual amplitude obtained compared to the amplitude which you have chosen to deliver; this one was done at a mean airway pressure of 10 cmH2O, and the pressures were measured proximally in the ventilator circuit . The sensormedic (SM3100A in the figure) does what it says on the box. Others have certain limitations that need to be understood, for example, the VN500 of Draeger doesn’t achieve the higher set amplitudes when used with a 3.5 mm endotracheal tube (the black symbols) but is capable of doing so with a 2.5 mm tube (the open symbols). This particular relationship isn’t affected much by the frequency (5 (circles), 10 (squares) and 15(diamonds) Hz). For the old Draeger Babylog (BL8000) the graph is a bit misleading as they have plotted the achieved amplitude against the %Max, which we always knew was not the same as amplitude in cmH2O. It certainly was not very good at achieving high amplitudes.
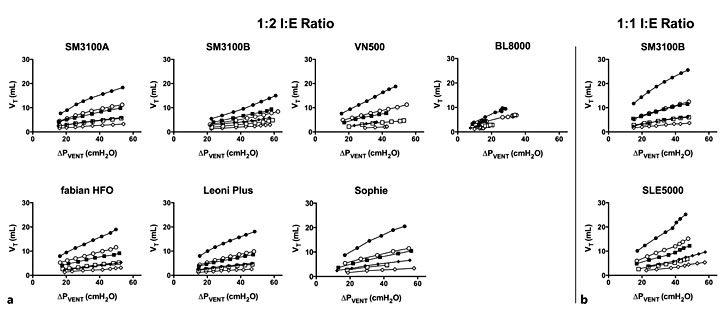
This graph shows that if you lot the amplitude actually achieved in the ventilator circuit against the tidal volume, it is about the same for all ventilator, ETT, and frequency combinations. So the regression line with the black circles looks about the same for all ventilators, as does the white diamonds, and so on. There are some minor differences, but I don’t think they are too important, clinically.
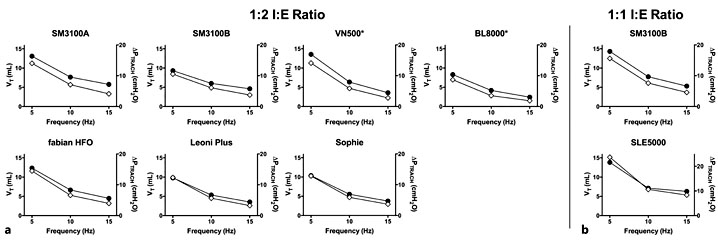
In this part of the study they put the ventilators at maximum amplitude and then changed the frequency. As you can see for each ventilator the tidal volumes fell as frequency increased, and there are some differences in the slopes; of note the VN500 couldn’t exceed 45 cmH2O at 15 Hz, and the Babylog 80o0 couldn’t achieve 45 at any frequency.

This one shows that what you measure in the circuit is hugely damped by the time you reach the trachea, the pressure amplitude in the trachea is much lower than the amplitude measured in the circuit for all experimental conditions.
I think these kinds of data are really important for use to understand how our equipment works. they also suggest some ways that we could consider limiting the use of certain ventilator settings.
On the other hand, the conditions tested were for some of the tests quite extreme. I very rarely use amplitudes which are so high, I would like to know a bit more about how the ventilators work at the mid-range of set amplitudes (even though I understand why the extremes would be chosen for this evaluation).
This is a graph from one of the other articles I referred to; John et al. It shows the relationship between the frequency and the amplitude achieved at the airway opening in the same lung model and circuit, again the authors set the ventilator to an extremely high amplitude (90 cmH2O), and compared the effects of increasing the frequency between the Sensormedics (diamonds) and the Draeger VN500 (circles). In the right-hand panel they look at the achieved tidal volume between the Sensormedics (triangles) and the VN500 (squares).
As you can see there is a marked drop in the achieved amplitude with increasing frequency on the VN500, which is not seen with the Sensormedics.
The tidal volume in the lung model drops rapidly with an increase in frequency, with both oscillators, but this drop is relatively greater with the VN500. The closed symbols are for a 1:1 I:E ratio, the open symbols are for 1:2.
There is a huge amount of information in these articles (and the on-line supplements), I encourage anyone who uses one of these oscillators to read and digest them. You will probably learn something that will help your practice.